Reserve releases declined to less than 5% of premium. Insurers projected a combined ratio over 120% on 2019 earned business, an amount unlikely to change significantly as reserves develop. Frequency increased for many writers and the trend in indemnity severity was above inflation—notably so in certain markets. In response, insurers began to take rate action, manifesting in growth in direct written premium that exceeded inflation for the first time since 2005.
Despite significant underwriting losses, the MPL industry returned double its net income for the year as dividends to policyholders. Policyholder dividends show little sign of declining as the MPL industry remains well-capitalized and able to fund policyholder dividends with investment income. Surplus increased by 3%, primarily due to unrealized capital gains from common stock investments. While measures of surplus adequacy declined almost 10% from 2018, we believe the additions to premium and reserves that drove this decline have put insurers on better footing at the end of 2019 than at the beginning. (Surplus adequacy is the risk-based capital ratio.)
For more than a decade, the favorable operating ratios in the MPL industry have had one primary cause—the release of prior-year reserves. However, this has declined from an average contribution of 28 points in the decade preceding 2017 to 15 points in 2017 and 2018, and to less than 5 points in 2019. The pattern of reserve releases suggests the favorable development may come to an end for the industry aggregate in the near term. However, individual company results for this metric in particular are expected to vary significantly.
The industry’s trend of declining frequency ended several years ago. Since then, the reporting of claim counts has stabilized for most companies. Some volatility is evidenced for certain writers as well as increases seen in a number of markets in 2019. Per annum trends in defense costs remain in the mid-single-digits. Indemnity severity trends escalated to a similar level in 2019. The primary driver of the increased severity was claims in higher coverage layers; increases have also occurred in lower coverage layers.
In part, consolidation in healthcare— and the resulting availability of higher limits—has driven this trend toward larger indemnity payments. Yet independent physician claims are also demonstrating larger severity, suggesting that perhaps the larger verdicts and settlements from higher limits have set an expectation of indemnity even at lower policy limits. Healthcare consolidation has also resulted in declining market share. Discussions of a single-payer healthcare system, while taking various forms, suggest that an abatement of the trend in physician employment is unlikely— change and uncertainty are hardly an encouragement to independent physician practices.
Rates began to increase in 2019 and are likely to continue to increase at a faster clip in 2020. Certain markets may see double-digit rate increases. Companies are expected to focus on pricing for higher policy limits as well as corporate policies, which have begun to serve as a source of limits for higher-dollar claims. The frequency of corporate coverage triggers has typically exceeded the expectation within policy pricing.
This snapshot of the current status of the MPL industry is based on industry composite financials. The information used in this special section is drafted from the composite financial results of 55 of the largest specialty writers of MPL coverage (“the composite”). Using statutory data obtained from S&P Global Market Intelligence, we have compiled financial metrics for the industry based on:
- Written premium
- Overall operating results
- Reserve releases
- Capitalization
- Policyholder dividends
In considering the financial results discussed above and further below, note that the 55 companies included here are all established MPL specialty writers. The composite excludes any MPL specialty writer that has become insolvent or otherwise left the market as well as multiline commercial writers and smaller writers. Companies that make up each of these three excluded categories are generally less well-capitalized than the 55 companies included here.
Underwriting results of the multiline commercial writers, as well as some of the smaller writers, have generally been somewhat less profitable. Of course, this was also true for the writers that became insolvent. Thus, the results presented below reflect the experience of the established specialty writers, which is inherently more favorable than a view of the industry as a whole.
Written premium increases
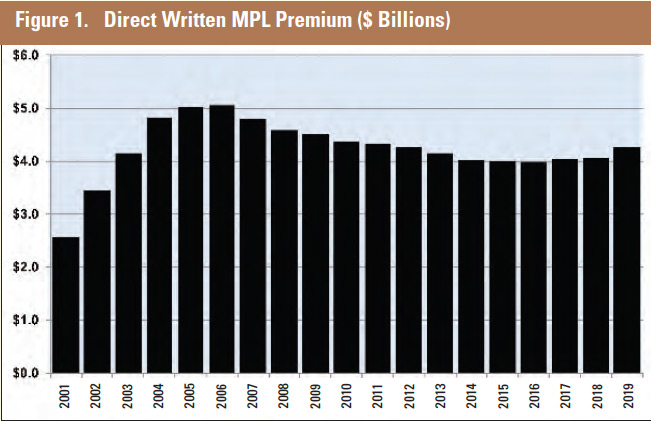
2019 is the first year since 2005 in which direct written premium for the MPL industry has increased by more than inflation. This follows 15 years of generally declining premium, although there have been small increases since 2016 (Figure 1). Cumulatively, premium decreased by $1.1 billion between 2006 and 2016—approximately 20% of the premium written at the beginning of that decade. To put that in perspective, consider that in the 40-year history of the MPL industry no other period of decreasing premium has lasted longer than two years and the greatest consecutive-year premium reduction was 7%.
Declining rate levels were only one factor driving premium decreases during this time frame. Also contributing to the lower level of premium was the loss of business to self-insurance mechanisms. Throughout this time frame, MPL companies lost business due to healthcare system acquisitions of both hospitals and physician practices, which typically then joined the self-insurance mechanisms of these systems. In earlier years— through about 2008—companies also frequently lost business due to the formation of new captives.
In 2019, the market transitioned to a hardening market, exiting a soft market with notable differences from the preceding soft market of the mid-to late 1990s through the early 2000s. Both soft markets showed inadequate rate levels, but the degree of rate inadequacy was less, and present in fewer locales, in this most recent soft market than in the previous soft market.
During this earlier time period, rate deficiencies—including those documented in rate filings—ultimately culminated in adverse financial results. The reduction in frequency since the early 2000s has put MPL rates in a better position than they were 20 years ago. Nonetheless, insufficient premium is evident in a number of markets currently, although there is rate action by carriers to address these deficiencies.
Overall operating results strengthen
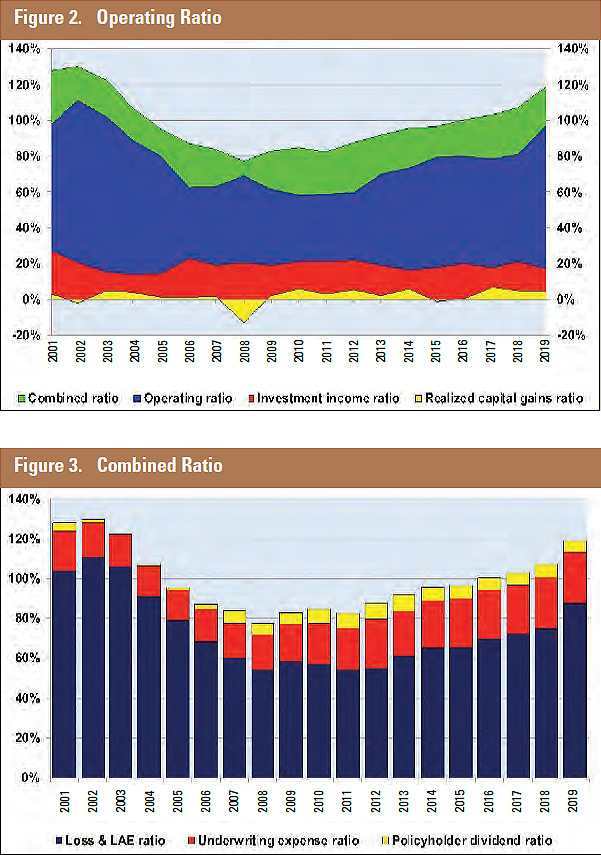
As measured by the operating ratio, the industry reached its peak profitability during 2010. In that year the composite posted an operating ratio of 58%, which has risen to 97% since that time (Figure 2). Increases in the operating ratio had been gradual until the industry filed 2019 results, posting an abrupt 16-point increase over 2018.
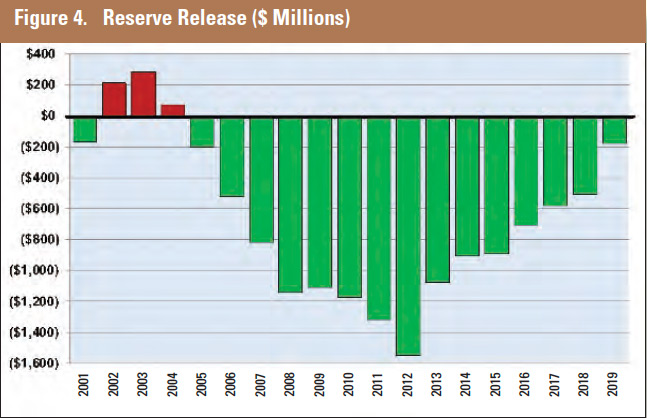
Declines in reserve releases drove this deterioration in the operating ratio, and increases in underwriting expenses exacerbated it. The 2019 combined ratio for the industry was 119%, up more than 40 points from a low of 77% in 2008 (Figure 3). With a combined ratio above 100% for each of the past four years, the industry now relies on its investment income for its profitability.
Investment gains remained high in 2019 at almost 22% of premium. Investment gain ratios for the composite have been above 20% each year since 2008 with the exception of 2015. The lower investment gain ratio of 2015 was mostly due to a large carrier’s accounting treatment of its investment in its affiliates. The investment income ratio fell slightly to 17% in 2019, about 2 points less than the preceding five to 10 years. The composite’s capital gains ratio remains relatively consistent with prior years at about 4%.
The 2019 calendar-year loss and loss adjustment expense (LAE) ratio of 88% is higher than any year since 2004 and represents an increase of over 30 points since the 2008 to 2011 time period. As noted earlier, the decline in reserve releases has driven this increase.
The starting loss and LAE ratio for each coverage year has changed little during this time period, although at 92% in 2019 it is about 4 points higher than the preceding years. This increase combined with the greater premium in 2019 suggests the 2019 coverage year is starting from a stronger position than other recent coverage years.
Despite this, we believe reserve releases will continue to decline prospectively. The industry added loss and LAE to the 2016 through 2018 coverage years as adverse reserve development during 2019, suggesting little room for improvement in 2019 itself. The industry saw a dramatic decrease in reported frequency during the 2000s. For most companies, frequency on a per-physician basis has since stabilized. Some writers saw notable increases in frequency in 2019. Coupled with higher severity, this presents a magnified challenge for these writers.
Given earlier rate decreases, frequency has of course increased more relative to premium than to the number of insured physicians. Reported frequency per $1 million of direct earned premium increased significantly leading into 2012, although increases have been smaller since then. Thus, for every claim reported, fewer premium dollars have been available to defend or settle the claims than was the case at the beginning of this time frame.
Cumulatively, reported claim frequency (measured relative to premium) has increased by almost 40% since 2009. This increase is largely the result of rate decreases that are mostly in the form of greater premium credits, as opposed to manual rate changes.
Reserve releases preserve profitability
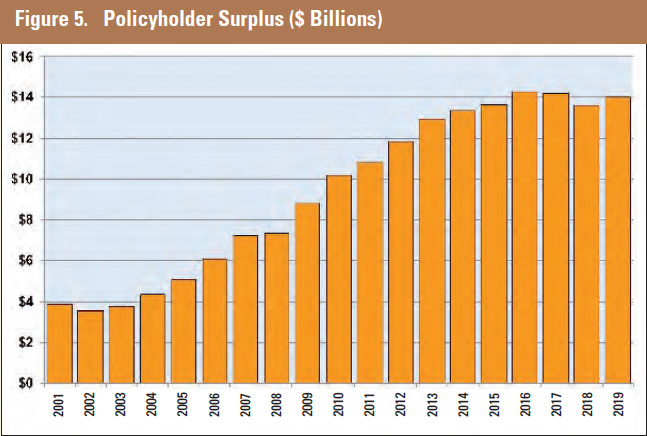
The composite released less than $200 million in reserves during 2019, an amount that has declined annually from the $1.1 to $1.5 billion released in each of the years 2008 through 2013 (Figure 4). Without this release, the operating ratio of 97% would have pierced 100%, making the industry unprofitable. When considered in the context of the reserves carried by the composite, they represent 2% of the $9.9 billion reserve carried as of year-end 2018, a smaller portion than in previous years.
A history of favorable calendar-year reserve development is not necessarily indicative of redundant reserves or even adequate reserves currently. A review of calendar-year development segregated by coverage year shows that favorable calendar-year reserve development has historically continued two to three years past the point when reserves were subsequently found to no longer be redundant. Historical patterns would suggest the small amount of reserve development during 2019 may indicate adverse reserve development in future calendar years.
Capitalization improves
Despite underwriting losses, the composite’s surplus increased during 2019 from about $13.6 billion to $14.0 billion (Figure 5). This increase was primarily due to unrealized capital gains in the companies’ common stock portfolios. Net income for the composite contributed $100 million to the surplus growth, an amount less than any year since 2003.
Despite the increase in surplus, the risk-based capital (RBC) ratio for the industry declined from about 1150% to 1050% during 2019. The RBC ratio provides a comparison of a company’s actual surplus with the mini mum amount needed from a regulatory perspective. However, from a practical perspective, given market fluctuations, many would consider the practical minimum amount of capital needed to be well in excess of this regulatory minimum.
The increase in reserves and premium drove this decrease in the RBC ratio as the metric treats increases in both quantities as indications of greater exposure to loss. Despite the decline in this ratio, the increases in premium and reserves represent improvements for the industry that leave it better positioned at the end of 2019 than it was at the beginning.
Policyholder dividends remain significant
MPL writers continued to pay a significant amount of policyholder dividends in 2019. Collectively the composite paid $200 million in policyholder dividends, exceeding the $100 million remaining as net income after these payments. This represents 5% of net earned premium, only a slight decline from the level in recent years (Figure 3). Cumulatively, the composite has paid $3.4 billion in policyholder dividends since 2005.
MPL writers have sustained a steady pattern of policyholder dividend payments, despite a decline in the reserve releases that have historically funded these dividends. In 2019, for the first time, the amount paid as policyholder dividends exceeded reserve releases for the composite. Since 2013, policyholder dividends have constituted approximately one-third of net income in each year. This represents an increase from an average of approximately 25% of net income in each of the six years preceding 2013. In 2019, policyholder dividends were double net income for the composite.
Typically, companies pay these dividends to all renewing policyholders as a percentage of premium. Thus, on a dollar basis, the dividends have provided greater benefit to those physicians who have historically paid higher premiums. We expect that policyholder dividends will continue for several more years, given their consistency over the past decade and the composite’s strong balance sheet.
Profitability expected to improve—but greater uncertainty ahead
We expect insurers will continue to take rate action during 2020, increasing premium in an effort to improve underwriting results. Reserve releases will become less common, resulting in less distinction between calendar year and coverage year results, at least in the near term. At the same time, insurers face a multitude of risks, including:
- Possible continued increases in frequency and severity
- Challenges to tort laws
- Uncertainty surrounding the push for single-payer healthcare
- Declining market share
- Uncertainty regarding the novel coronavirus
Stock market declines in early 2020 will depress MPL companies’ capital, although the continued direction of these asset values remains highly uncertain. MPL companies maintain most of their investments in bonds, somewhat insulating them from stock market declines relative to other industries. The impact of unemployment on the MPL industry is uncertain, but the experience of the 1980s would suggest higher claim frequency may result.
In the early 2000s, the start of the hard market was steep and quick, with double-digit rate increases common across states and carriers. In contrast, rate increases in the emerging hard market are expected to be smaller and to vary more across markets. As noted earlier, recent rate inadequacies have been less—both in magnitude and geographic spread—than in the preceding soft market of the late 1990s, placing less pressure on rates now. Nonetheless, certain market segments are likely to experience double-digit rate increases during 2020 and perhaps 2021.
Despite the generally smaller rate changes, it is striking how quickly the market has begun to harden from a year ago. At the beginning of the previous hard market, the combination of 9/11 and St. Paul’s withdrawal from the MPL industry resulted in a rapid and steep decline in available capital. Combined with the recognition of significant rate inadequacies and low levels of capital among many remaining writers, large double-digit rate increases soon followed. The current hardening market seems more to be a function of a slow but clear recognition that reserve releases, declines in frequency, and nominal trends in indemnity severity are no more.
Compounding general uncertainty in the market is the novel coronavirus, the impact of which may be felt in the MPL industry for several years to come. While direct claims stemming from the virus are possible, three factors are of potentially greater concern:
- The overall impact on healthcare availability
- The postponement of nonessential medical care
- The impact on capacity in the healthcare industry prospectively
These impacts may be felt in healthcare for years as a bottleneck of medical needs builds and providers may decease or become debilitated from the coronavirus. In addition, the delays in civil litigation across the country due to the virus may obscure the true results of the 2020 business. Had the circumstances of the MPL industry not already brought the arrival of a hardening market, it seems likely the uncertainty from the coronavirus combined with its general economic impact would have done so.