Doctors assigned to a Minor Surgery class usually pay a higher premium than doctors assigned to a “No Surgery” class. But Minor Surgery is a vague term. What does it really mean? The answer depends on who you ask. A general surgeon likely has a different answer than a family practice doctor. Both answers likely differ from that of the average patient. Doctors seeking coverage probably care most about their malpractice carriers’ opinion, since that is the one that will impact their premium. While carriers maintain guidelines, ultimately those guidelines are implemented by an underwriter.
In outlining the above, several questions come to mind, including:
- Do all underwriters within a carrier have the same answer?
- Is the answer provided by one or more underwriters consistent with the guidelines?
- Is the definition of minor surgery empirically determined in such a way that there is a meaningful loss differential?
- Do the guidelines implement the actuarial assumptions that underly a carrier’s rate structure?
While these questions are fundamental to the financial performance of all MPL carriers, it is challenging to understand and manage practical answers to these questions. The more important question is how carriers can achieve the consistency required to realize their financial goals This article covers techniques for using data to solve this problem. Minor surgery provides a use case that illustrates the benefits of data analysis using large data sets in claims underwriting.
What Data Is Available?
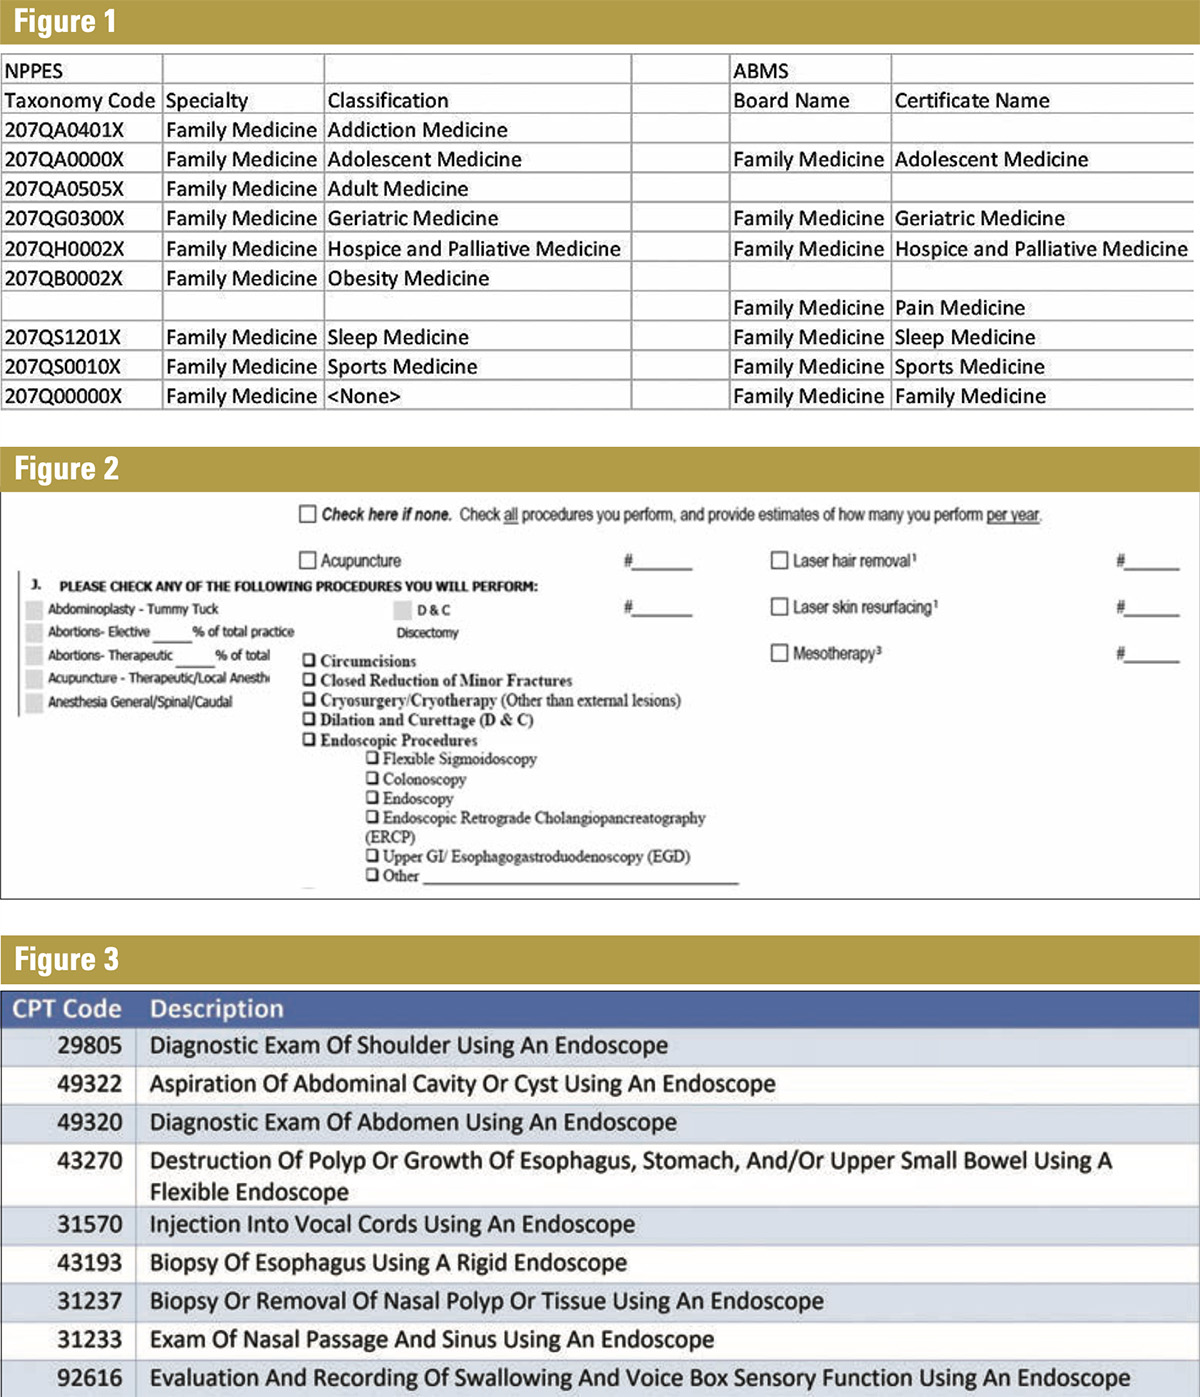
Doctors’ training is critical in determining their specialties. Two common sources of data for provider training are the National Plan and Provider Enumeration System (NPPES) or the American Board of Medical Specialties (ABMS). If a provider registers as a family medicine practitioner or obtains board certification from the Board of Family Medicine, the provider was likely trained in that specialty. Figure 1 shows the taxonomy codes in NPPES and the Certificate names from ABMS for Family Medicine.
While useful for labeling a provider as a family medicine specialist, none of the classes or certificates help with a Minor Surgery designation. Knowing this, many carriers require that providers complete applications detailing the procedures they perform. A sampling of applications is shown in Figure 2.
Underwriters use the completed application and follow-up with the applicant as necessary to compile the information they need. However, there are potential gaps that this type of application process can create, including possibilities that:
- New procedures were introduced after the application was first published
- The practitioner who filled out the application interpreted the questions differently than the carrier intended.
- The applicant was not fully transparent
- The applicant forgot something
A well-trained and experienced underwriter uses the application process to identify these issues and correctly assign a provider to a class.
What Other Data Might Help?
Medical billing data is a by-product of the insurance-driven medical delivery system. When a patient sees a provider and has a procedure done, the provider submits a bill to a health insurance company for reimbursement. While this data is expensive, computationally challenging, and complex to interpret, it does contain valuable information that facilitates profiling a provider’s clinical activity. The data science team at Preverity has spent six years curating 80 billion transactions to distill clinically relevant information that determines each physician’s clinical practice profile.
For minor surgery, because there is no universally accepted definition of this term, there’s no way to know how a procedure could be described as minor surgery, such as endoscopies. To that end, there is not a field that defines whether a provider performs endoscopies. The American Medical Association defines 304 different Current Procedural Terminology (CPT) codes that represent endoscopic procedures that can appear on medical bills. Figure 3 provides a partial listing of these codes and a description of the corresponding service.
With access to historical billing data, carriers can determine if a provider is performing endoscopies by finding one of the 304 endoscopy codes in the billing data. This method has at least three advantages:
- Consistent application of rules: Either the doctor has billed and been reimbursed for one or more of those codes or they have not. There’s no ambiguity or misunderstanding.
- Ability to streamline the application and underwriting process: Access to data means there’s no need to ask the provider.
- Potential to perform what-if analysis: Finally, and perhaps most importantly, the billing data can be collected for whole populations of providers for long periods of time. Carriers can use historical data to perform what-if analysis and evaluate the potential performance of new rate classes.
Malpractice Claim Frequency
Malpractice claim frequency is the percentage of providers in a population that have a malpractice claim over a period of time. Calculating frequency is simple: divide the number of providers with a claim by the total number of providers in the population. Different stakeholders may have a variety of definitions for claims, populations, and time periods, but the calculation is similar. The data in the rest of this article uses the population of Family Medicine providers in Preverity’s database and an annual period. For reference, historical frequency for Family Medicine providers is about 1.7%.
Putting Everything Together
The Preverity population of Family Medicine includes all types of doctors, including those who perform surgeries. Suppose you had a theory that providers who perform endoscopies are higher risk than those who do not. How would you test it?
Without billing data, if endoscopies are an element on your application and past applications are archived, perhaps analyzing those applications would provide insight. If not, a survey over a segment of your insured base might work.
This question may be answered with billing data that can be available for most physicians. Using available data, we find that 17.4% of the Family Medicine doctor population performs endoscopies and when matched with event data, we see a frequency rate of 2.04% among those physicians.
That contrasts with a frequency of 1.17% among the 82.6% who do not perform endoscopies, resulting in a relative frequency of 1.74. In other words, a doctor who performs endoscopies is 74% more likely to have a claim than one who does not.
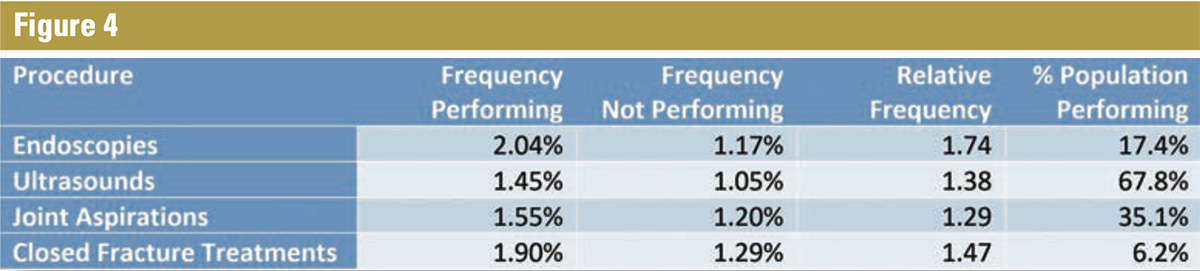
The same process applies to other billed procedures as seen in Figure 4.
Following the original hypothesis, if endoscopies are the only determining factor between two populations, then they appear to be higher risk. If the data passes additional actuarial checks, you might choose to implement a minor surgery rate class based strictly on whether a doctor performs endoscopy procedures as seen in Figure 5.
To test different scenarios, you might vary the procedure that provides determination or test procedural combinations. For example, using Endoscopies and Closed Fractures to create classes changes the picture as seen in Figure 6.
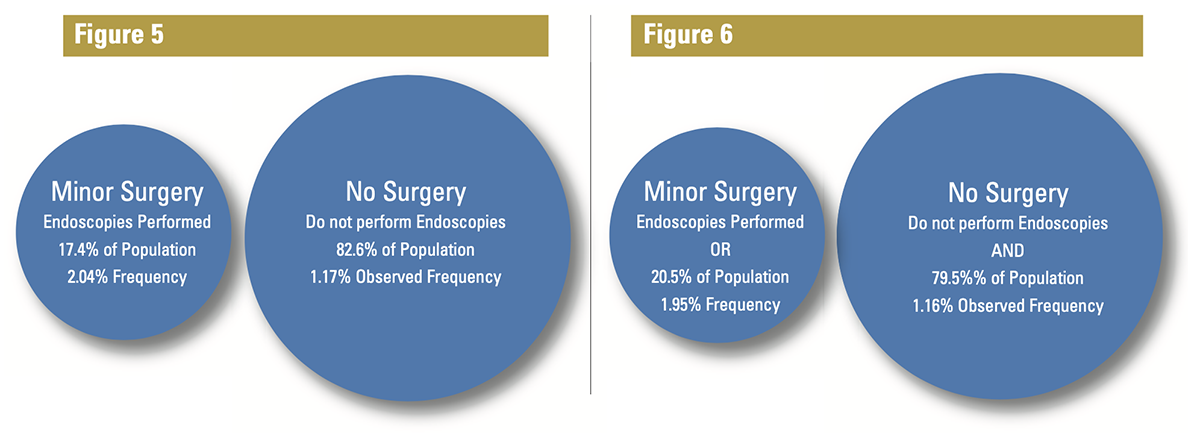
Adding Fracture treatment, which is performed by 6.2% of the total population, only added about 3% of physicians to the Minor Surgery designation. The difference is due to the overlap in procedures performed because some doctors perform both endoscopies and treat fractures. Also note that adding fractures to the Minor Surgery bucket drops the overall frequency of that bucket to 1.95% from 2.04%, implying that the providers that were added were relatively less risky.
The Big Data Challenge
How do we know the data in this analysis is statistically and economically reliable? Using the fracture example, we see that only 6.2% of the providers treat fractures. Using a rare service does a poor job of separating providers between classes. More troubling, however, is that a small population with fewer events may not contain enough statistical power to be meaningful.
This is likely true for fractures in the example. In fact, research shows that about 200 malpractice claim observations in a population are required to be relevant.1 To get to 200 claim observations in Family Medicine, with a frequency of 1.7% implies about 12,000 insured year observations to make relevant judgements—a population few carriers have in their own population.
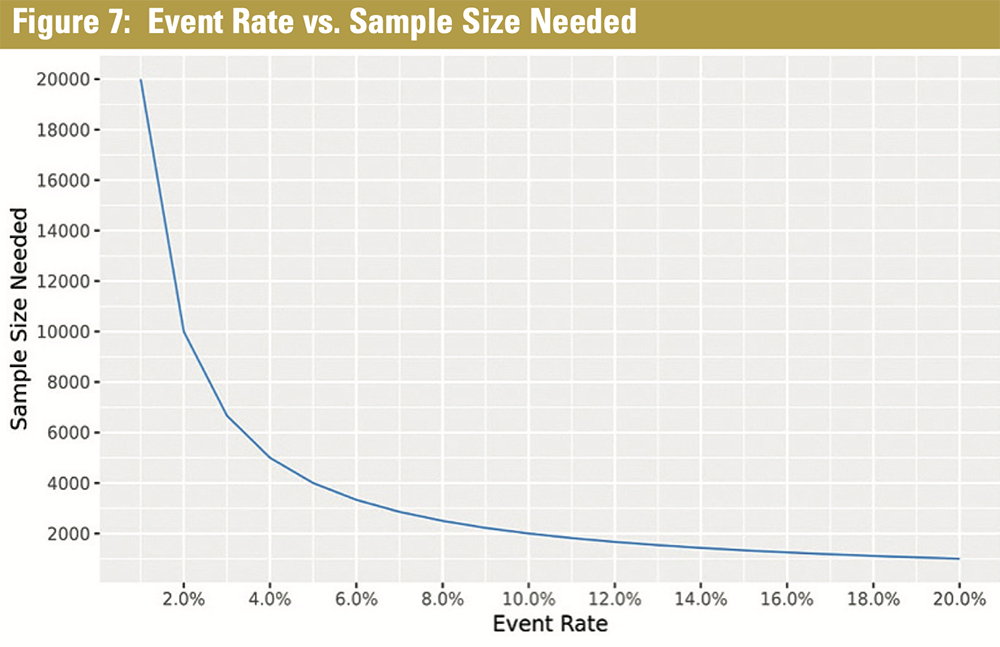
Figure 7 reveals the sample size required compared to the event rate. As the population is segmented by procedures performed, the overall population must be accordingly increased. Although this is conceptually straightforward, gathering the amount of data necessary required to perform a statistically defensible and reliable analysis is a significant challenge for most carriers.
Key Takeaways
Medical procedural data can be a useful source for helping to define rate classes based on observable provider activity. Procedural data is knowable historically and can be matched with known outcome data to provide a powerful basis for analysis.
These examples are simplistic in that they only consider the impact of one or two procedures. Having a database with this information enables the analysis of many different scenarios quickly. Once the data is matched, the same analysis pattern can easily be applied to different specialties, different geographies, and other subgroups of physicians to solve other problems, assuming the scale is large enough to maintain relevance.
References
Sample Size Considerations for the External Validation of Multivariable Prognostic Model: A Resampling Study, Statistics in Medicine, Jan. 30, 2016, https://www.ncbi.nlm.nih.gov/pmc/articles/PMC4738418/