There are numerous papers identifying the drivers of inflation and various impacts it may have on risk-bearing insurance entities. However, inflationary figures are based on consumer goods, energy, and a variety of other items that may or may not cause an increase in MPL severity. So, can we expect higher inflation to cause a rise in MPL indemnity severities?
In the data-first world in which we live, we thought interrogating the data may provide insight. First, let’s discuss terminology that will be important to the discussion.
Correlation
Correlation is a mathematical concept to describe how two variables relate to one another. It can range from -1 to 1, with negative values indicating a negative correlation and positive values indicating a positive correlation.
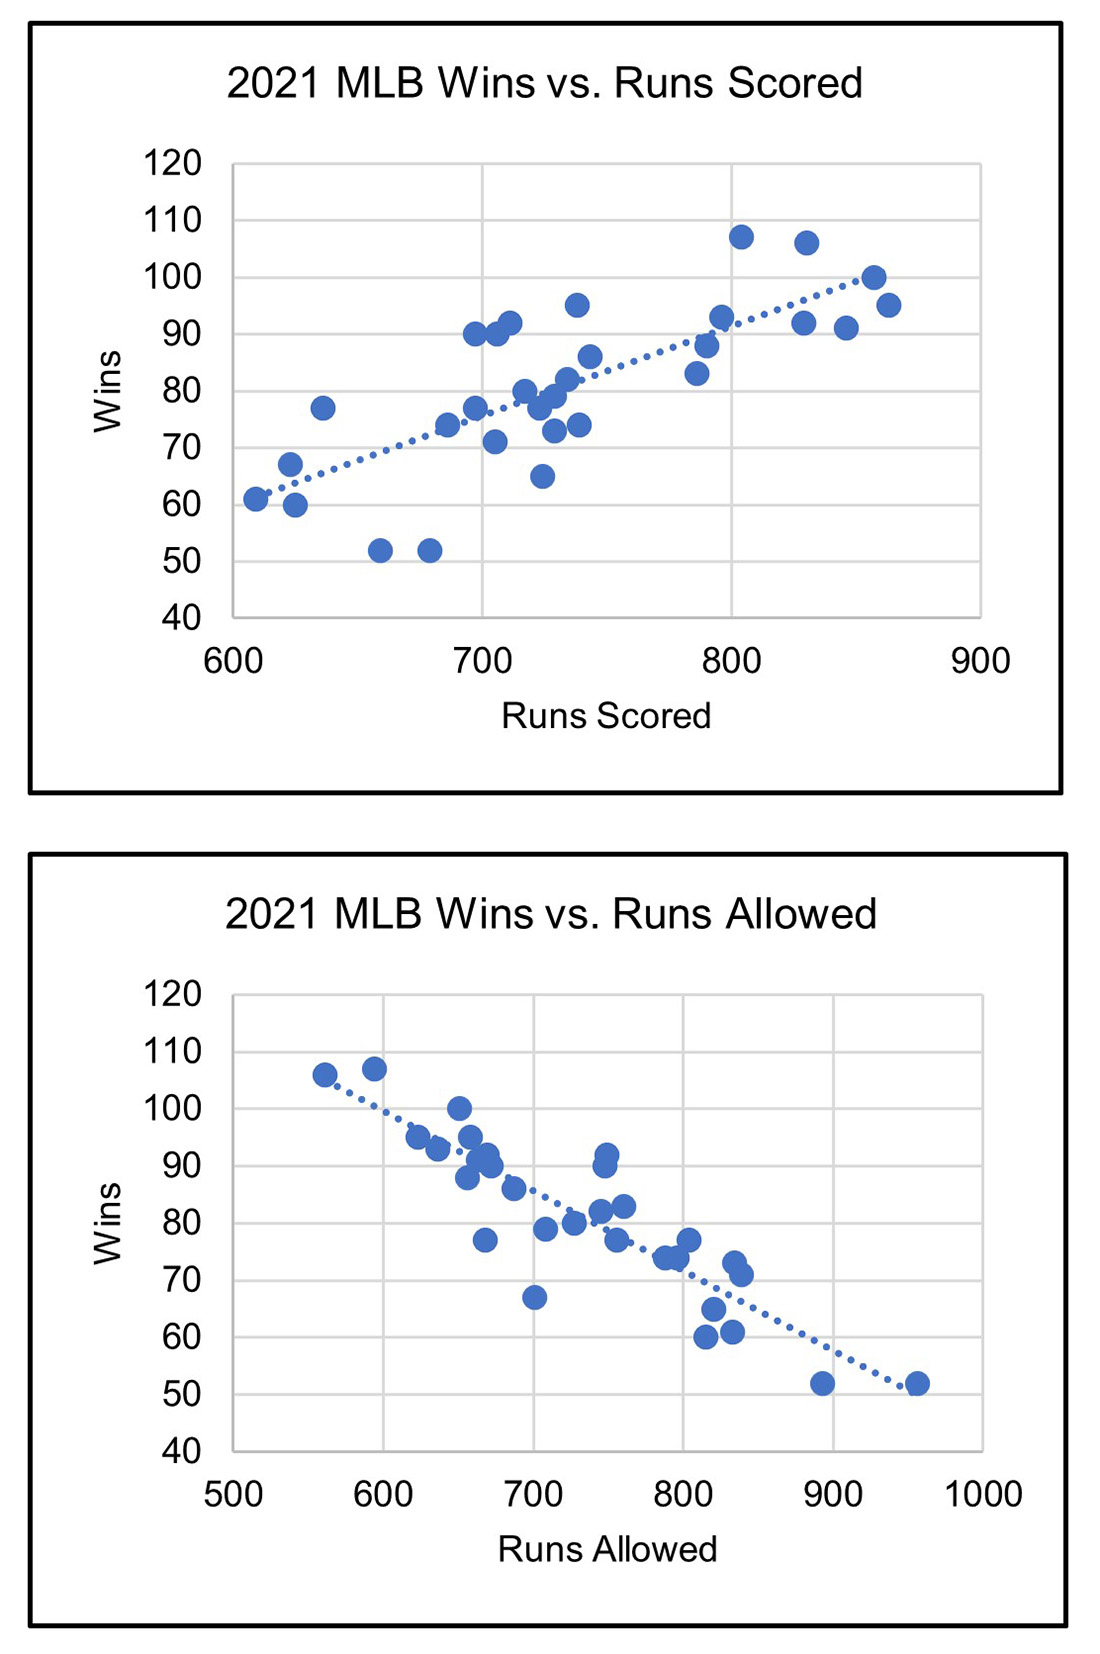
Positive correlation exists when an increase in one variable is associated with an increase in another variable. For example, professional baseball teams who score more runs over the course of a season tend to win more games. Therefore, runs scored and number of wins are positively correlated.
Negative correlation occurs when an increase in one variable is associated with a decrease in another variable. For example, the more runs a team allows their opponent to score over the course of a season, the fewer games they tend to win. So, runs allowed and number of wins are negatively correlated. Using scatterplots makes these correlations easier to notice.
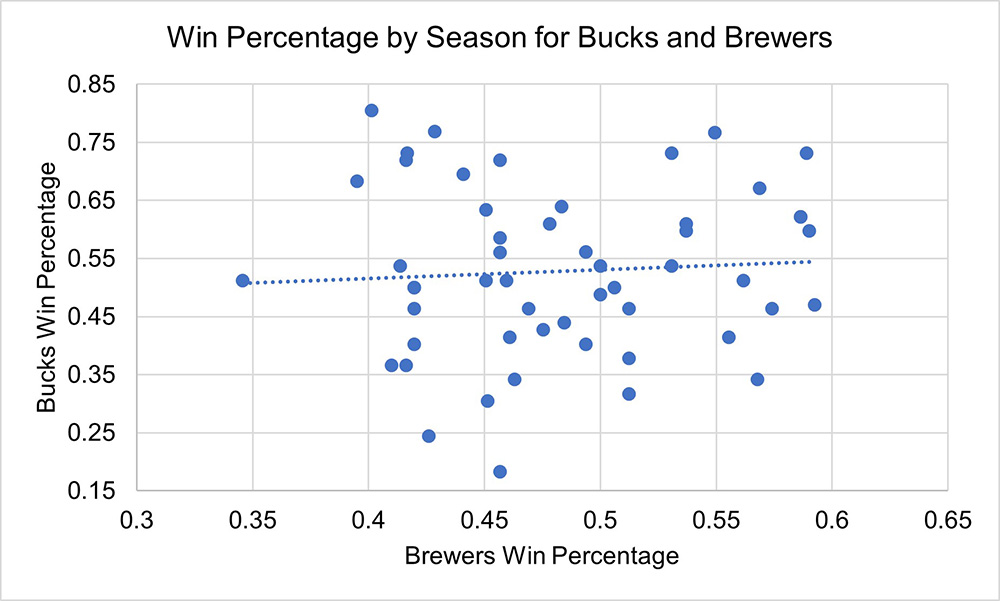
It’s also possible for two variables to have no relationship to one another. If this is the case, the variables are uncorrelated. An example of uncorrelated variables would be the win percentages of different sports teams within a city. Uncorrelated variables will have a correlation close to 0. When a scatterplot appears to have no pattern, this is a good indication of no correlation between variables.
CPI
Inflation, measured by the CPI (Consumer Price Index), is calculated by comparing the price of a “standard market basket” of goods to the price of that same market basket a year ago. The CPI is calculated monthly by the Bureau of Labor Statistics and is often looked at by category. Common categories include all items, energy, housing, wage, food, and medical.
MPL Indemnity Severity (shortened to “MPL severity” throughout)
MPL indemnity severity is the average indemnity payment made on MPL claims during a defined period. For this analysis, it is calculated from the National Practitioner Data Bank (NPDB) Public Use file. We used both ground-up MPL severity as well as several excess MPL severities to monitor correlation.
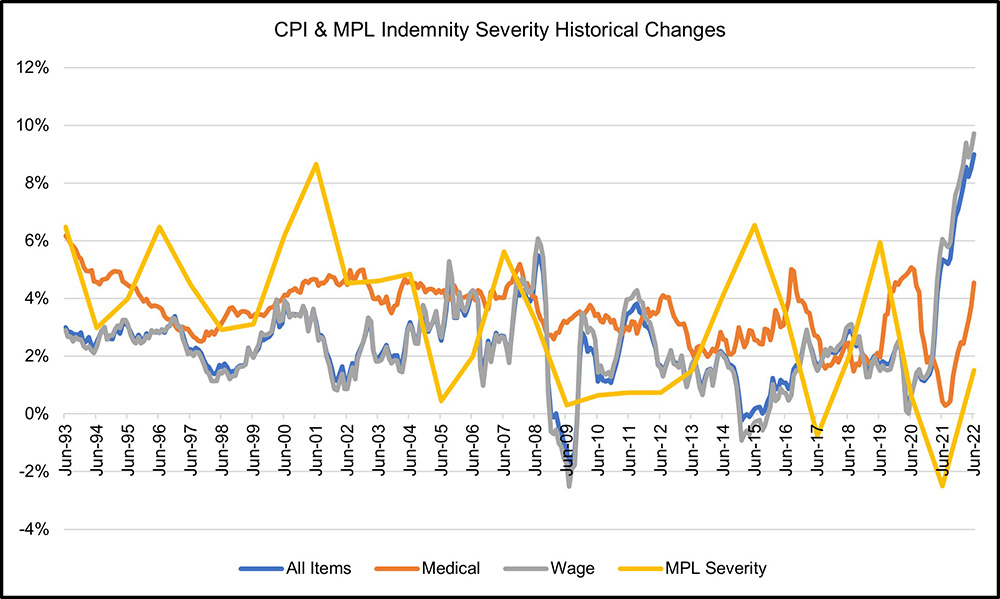
This graph shows the data available for MPL severity changes as well as the CPIs we tested. It’s worth noting that the all items CPI and wage CPI are virtually in lock-step here. Not coincidentally, their correlation over this time period is 0.99, or nearly perfectly correlated.
Method
The goal of this analysis is to use correlations to determine if MPL severity and inflation are correlated. MPL severity includes the tangible components of medical expenses and lost wages, as well as the intangible component of pain and suffering. It’s plausible to think that there is a positive correlation between MPL severity and CPI due to the tangible economic components included in MPL severity. To be able to compare “apples-to-apples” with CPI measures, we calculated the annual change in MPL severity. Then, we compared these changes with overall CPI, medical CPI, and wage CPI to see if any were correlated. We did this analysis at the countrywide level, then investigated the five largest MPL states (CA, FL, NY, PA, and TX) individually.
Results
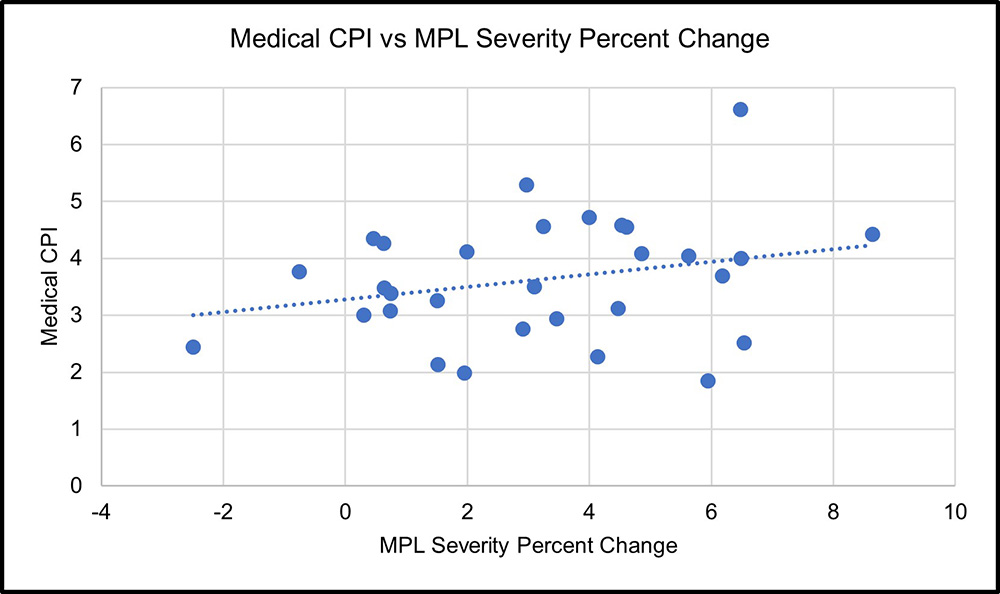
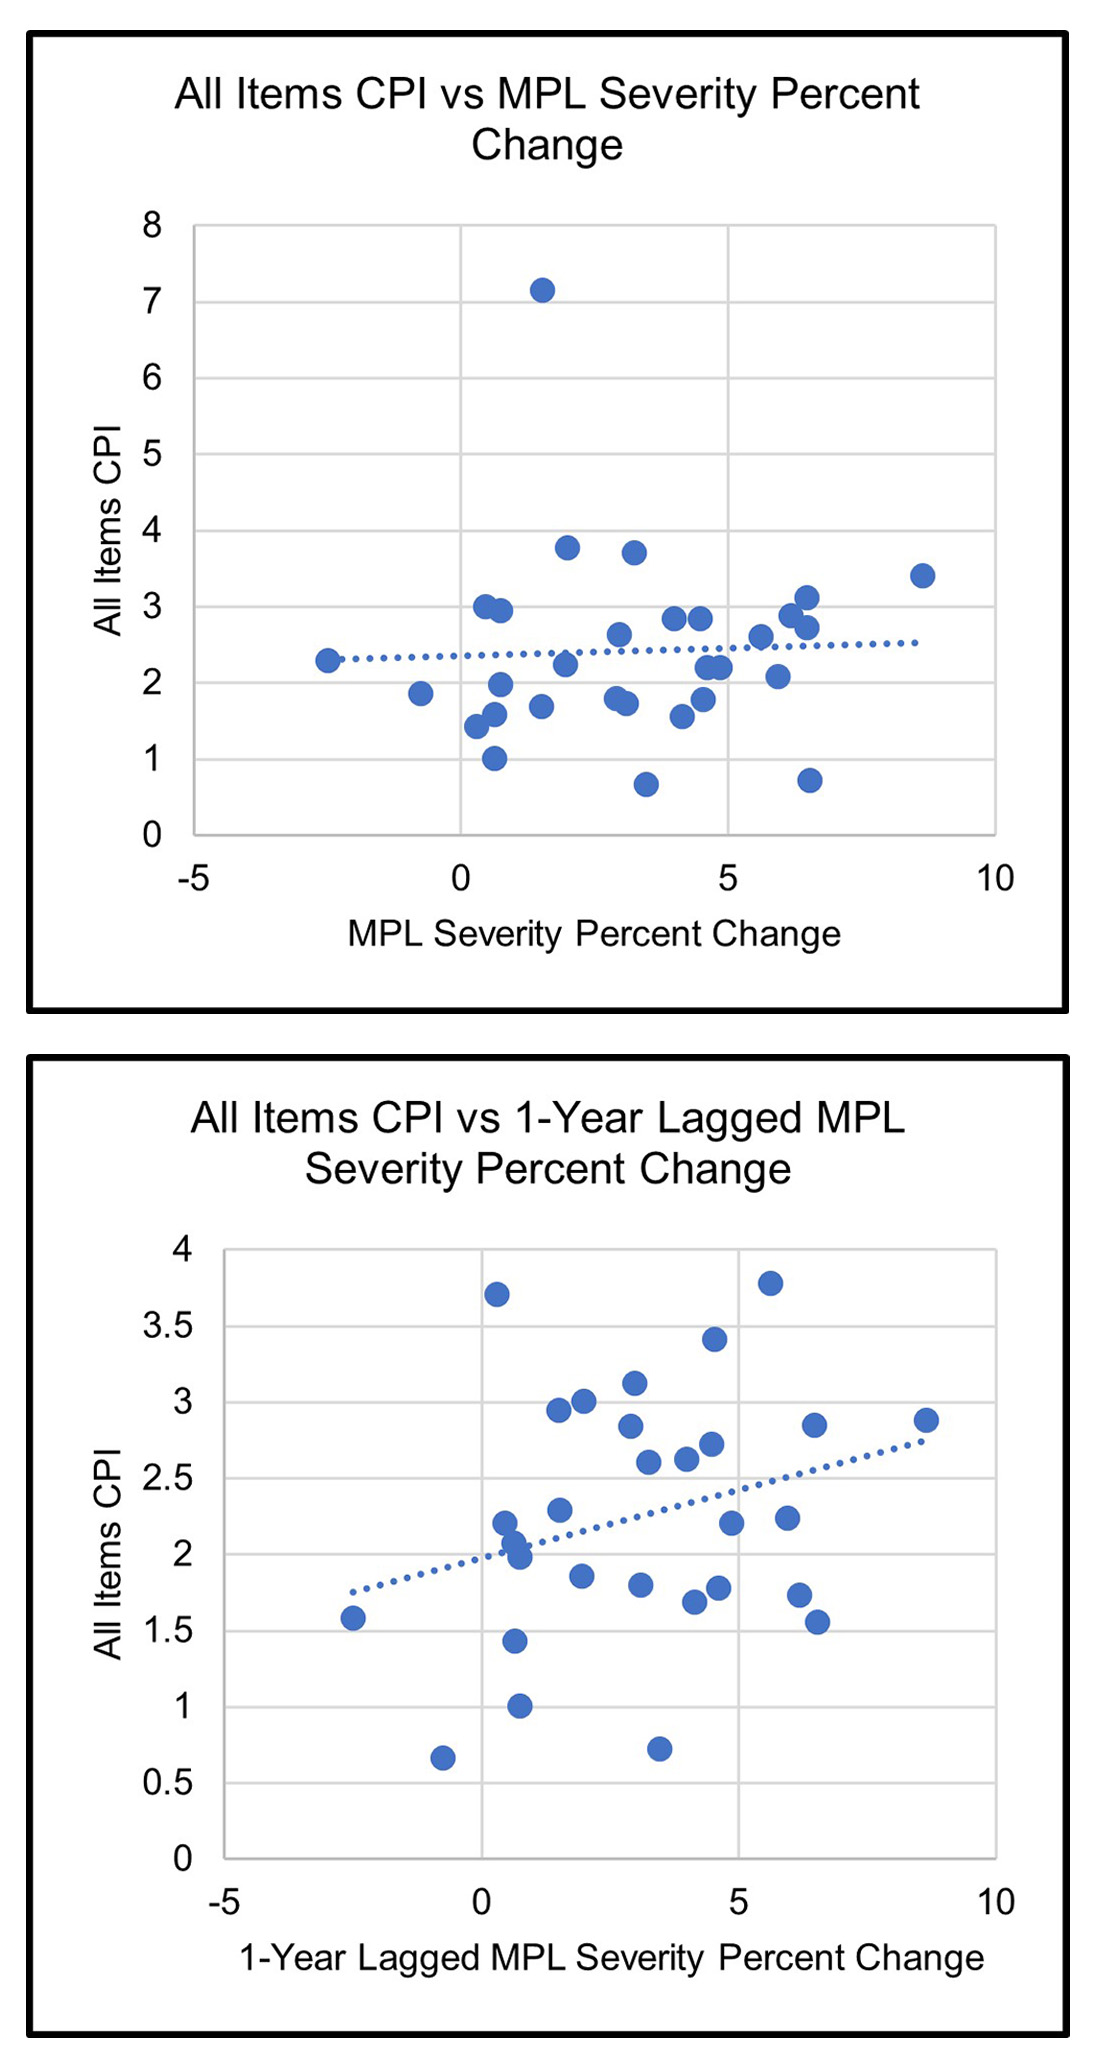
Among the three CPI measures we used, MPL severity was most strongly correlated with medical CPI, with a correlation of 0.27. This was somewhat expected, because a large chunk of MPL severity stems from medical expenses. The correlation between MPL severity and the other two CPI measures were essentially uncorrelated at .04 and -.02 for all items CPI and wage CPI, respectively.
Correlations between MPL excess severities and CPI measures were consistently weaker than correlations to ground-up MPL severity. The closest to ground-up MPL severity was correlating medical CPI to MPL severity in excess of $2 million with a correlation of 0.24, then MPL severity in excess of $5 million with a correlation of 0.11. The weaker correlations may be an issue of data credibility for these excess layers.
We also considered the possibility of a delay between a rise in inflation and a rise in MPL severity. We tested correlating CPI with a lagged MPL severity (this year’s CPI impacting next year’s MPL severity) and discovered a positive correlation with the all items CPI of 0.28. This is essentially in-line with the correlation of MPL severity and medical CPI discussed above.
However, it’s important to note that because we don’t have next year’s MPL severity, the current high inflationary period is excluded from the correlation. There are two conclusions one may draw from this: 1) there is a lagged effect and as a result, CPI is a leading indicator for an increase in next year’s MPL severity, or 2) the positive correlation only exists at lower CPI levels and doesn’t extrapolate to high-inflation years. Time will tell which of these conclusions is more appropriate.
It’s also worth noting that comparing these CPI to lagged excess severities resulted in no-to-negative correlation. These results ranged from a correlation of 0.03 (all items CPI vs. MPL severity excess $5M) to -0.43 (medical CPI vs. MPL severity excess $500,000).
Individual States
At the state level, the same general patterns emerged. Individual states’ MPL severity tended to have a minor positive correlation with all items CPI and medical CPI, using both lagged and non-lagged data. Individual states’ MPL severity correlations to all items CPI ranged from 0.44 to -0.13. The MPL severity correlations to medical CPI ranged from 0.34 to -0.09. The correlations do not appear to be tied to the level of tort reform in the state nor other obvious factors, and instead appear to be process variance (random fluctuation inherent in insurance and other areas).
Conclusion
The question on the minds of many is: “Will increased inflation translate into higher MPL loss costs”? In this analysis, we found some evidence of a minor positive correlation between MPL severity and medical CPI as well as with lagged MPL severity and all items CPI. Although we believe this to be representative of the relationship between MPL severity and CPI, without normalizing for other factors that can impact MPL severity, this conclusion is not concrete. So, even though inflation may have far-reaching impacts across the MPL insurance industry in terms of operating expenses, investment strategy, etc., there does not appear to be conclusive evidence that higher inflation will translate into higher loss costs.