Relative to last year, expected returns in 2023 have risen across the universe of asset classes that insurance companies invest in, with the most notable increases coming in fixed income. The higher yields driving the improved forecast are likely here for the duration of 2023, creating a window of potential opportunity for insurers to lock in attractive yields in both the traditional and alternative fixed income markets. This situation may prove beneficial for investment income for years to come.
A Look Back at 2022
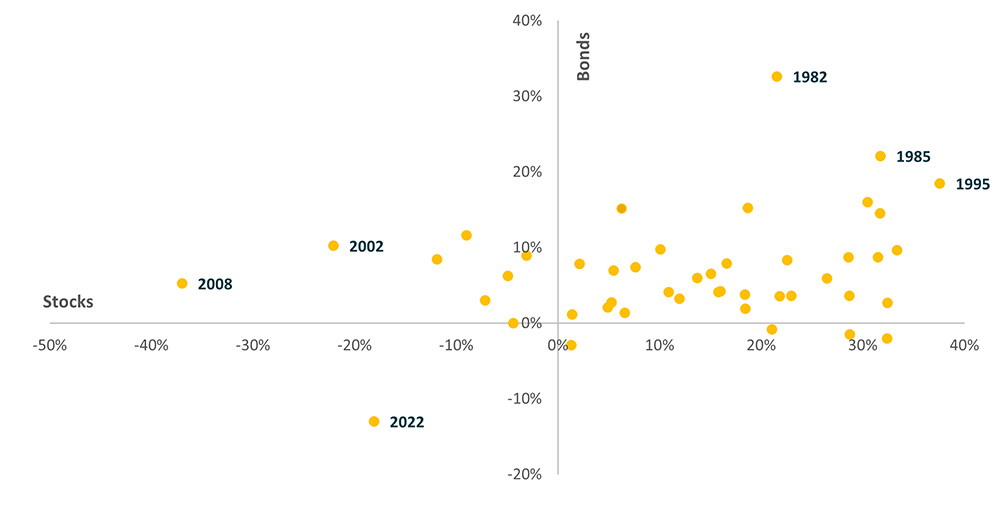
Last year, the US Federal Reserve increased rates dramatically in an effort to tame inflation. This led to the worst ever total return performance year recorded by the bond market since the formation of the Bloomberg Aggregate Index in 1977. It also marked the first time over this period that both stocks and bonds delivered negative returns in the same calendar year.
Figure 1. 2022: An Outlier for Negative Total Returns in Bonds and Stocks1
For Insurers, Investment Income Drives Earnings
While the 2022 bond market selloff hurt insurance companies’ unrealized gain/loss positions, the resulting higher reinvestment yields will benefit from the amount of investment income they generate going forward. Most companies are happy with that tradeoff, and to understand why let’s step back and consider the importance of investment income to the insurance industry.
Insurers have two primary sources of income: underwriting income and investment income. If we look at the property & casualty insurance industry in any given year, more often than not, the industry loses money on the underwriting side and makes money on the investment side. In fact, there was a 25-year period from 1979-2003 in which the industry, in aggregate, produced an underwriting loss in every single one of those years.
Figure 2. P&C Insurance Industry: Number of Years with Underwriting Profits2
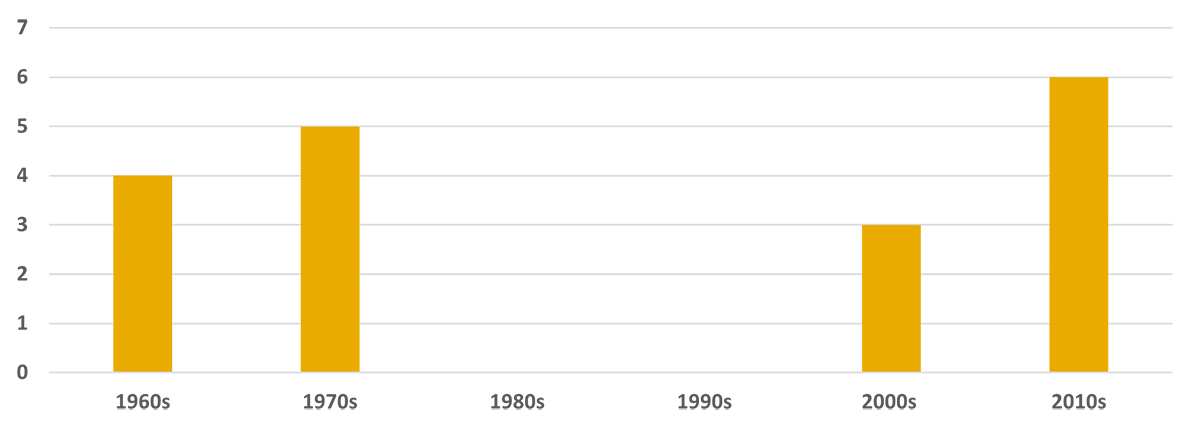
For an industry whose primary objective is to collect more premiums than it pays out in losses and expenses, it failed to do so for 25 consecutive years. Now, insurers could afford to swallow underwriting losses because interest rates were much higher back then, so a lot of it was intentional, but it’s still a mind-boggling statistic. The point is this: investment income has been and will continue to be the driver of earnings, so insurers welcome the increase in investment income they will see going forward.
Near-term Opportunity to Lock in Attractive Yields
As investors, it is important to observe bonds through a wide lens that includes both Treasury yields and credit spreads and how the two combine to create the total yield of a bond. In the first half of 2023, we have seen credit spreads tighten and Treasury yields inside of 10 years rise. However, as recessionary risks escalate, we believe spreads and rates will begin to move in opposite directions, with spreads widening and Treasury yields falling. Our view is that there’s a near-term window for insurers to lock in attractive all-in yields that will benefit their portfolios for years to come, and the length of that opportunity depends on how long you think it will take the Fed to reverse course on inflation and cut rates to support the economy.
All-in market yields as of June 30, 2023—as represented by the Bloomberg US Intermediate Aggregate Bond Index—stood at 4.8%, which is more than three times the level they were at in the beginning of 2022 and close to the high of 5.1% reached in October 2022.
Figure 3. All-in Yields Considerably Higher than at the Beginning of 20223
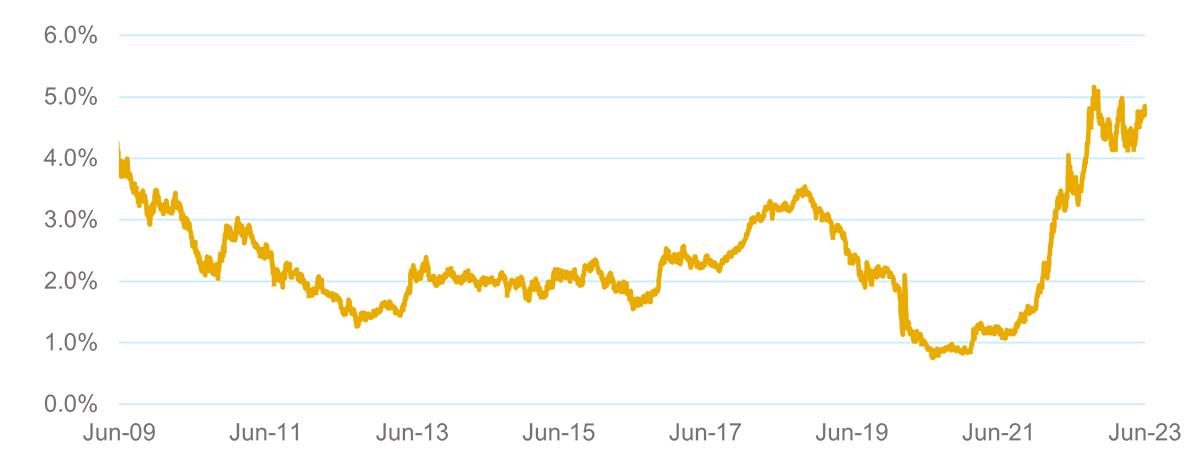
Yield to worst of the Bloomberg US Intermediate Aggregate Bond Index as of June 2023. Yield to worst is the lowest potential yield that can be received on a bond without the issuer actually defaulting. This metric is used to evaluate the worst-case scenario for yield to help investors manage risks and ensure that specific income requirements will still be met.
Insurance Asset Allocation Shifting toward Bonds
Given the increase in yields, it's no surprise that we're witnessing a shift in insurer asset allocations out of equities and into fixed income as the move in valuations has driven a divergence in relative value. To illustrate this divergence, we look at the Bloomberg Intermediate Aggregate Index, which exhibited a yield of 2.8% in March 2022. Our expected return at the time for core fixed income, as represented by this broad benchmark, over the next 3-5 years had been 3.3%, annualized.4
With the yield on the index having increased to 4.8% as of June 30, 2023, our forward expected return has increased to 6.3% using the same methodology. Compare that to equities, in which our forward return forecast has barely budged—7.9% last year compared to 8.3% today, using the S&P 500 Index as a proxy benchmark. To put that change into a portfolio context, last year an allocation of 80% core fixed income and 20% equities (using the two previously mentioned benchmarks as proxies) would have resulted in an expected return of 4.2%, annualized, over that illustrative 3-5 year period. Today, expectations of that same asset mix would be 6.7%.
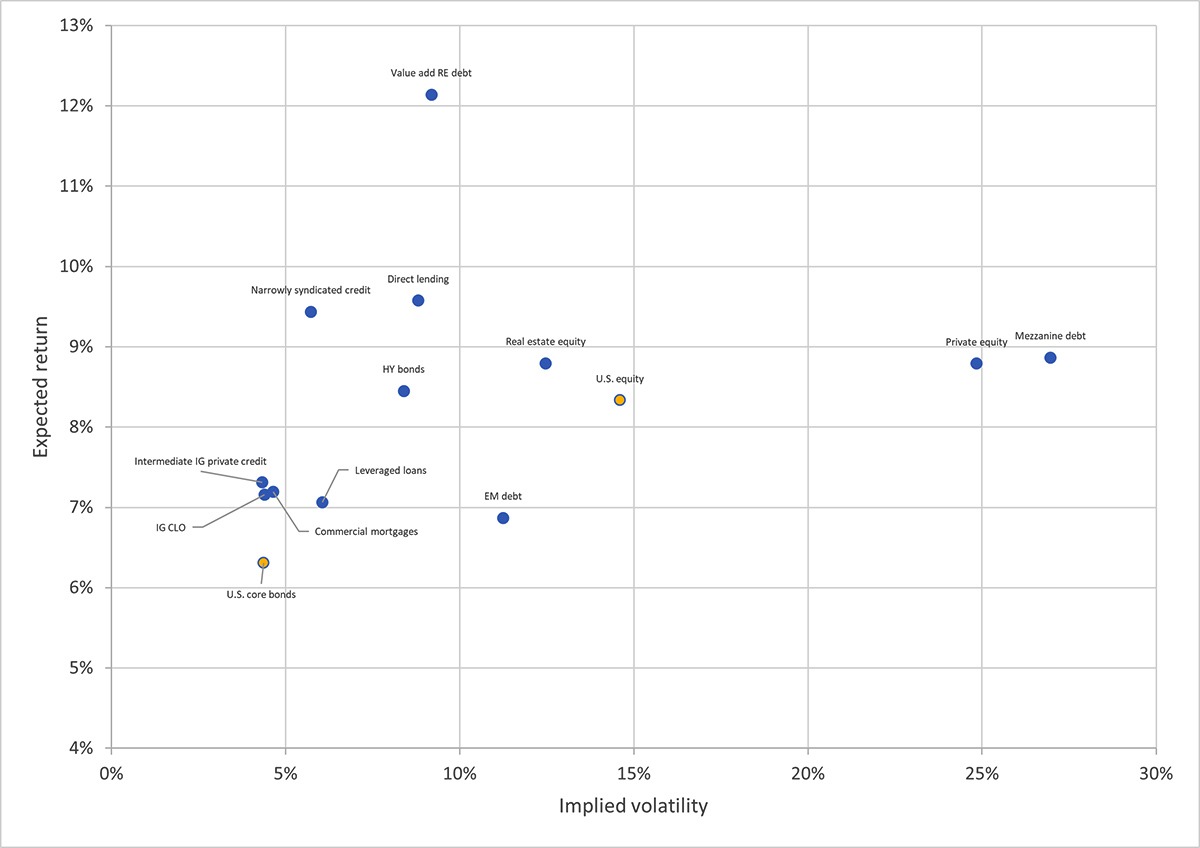
On a risk-adjusted basis, the change in relative value is even more striking. The following exhibit illustrates the historical volatility in core fixed income, as represented by US bonds, at 4.4%, a fraction of the 14.6% historical volatility on equities.
Figure 4. Mid-term Risk/Return Profile of Asset Classes Used by Insurers5
Elevated Claim Severity Impacting Ability to Take Advantage of Higher Yields
The inflation that has driven the spike in bond yields has also resulted in higher insurance claim severity, which is being felt in medical professional liability and many other P&C lines of business. Those higher claim amounts have directly impacted the ability of companies to reinvest in this market. Across our insurance client base, we’d bucket companies into four groups based on the degree to which they’ve been able to capitalize on the higher yields, in the following order:
- Haven’t been able to reinvest and were forced to sell bonds at a loss to cover claim payments
- Haven’t been able to reinvest but were able to cover claim costs using bond principal and interest payments (or other liquidity sources such as lines of credit), so they weren’t forced sellers
- Have been able to reinvest all cash flows and improve their average book yield
- Have been able to reinvest all cash flows and had the ability to harvest losses and reinvest those proceeds at higher yields
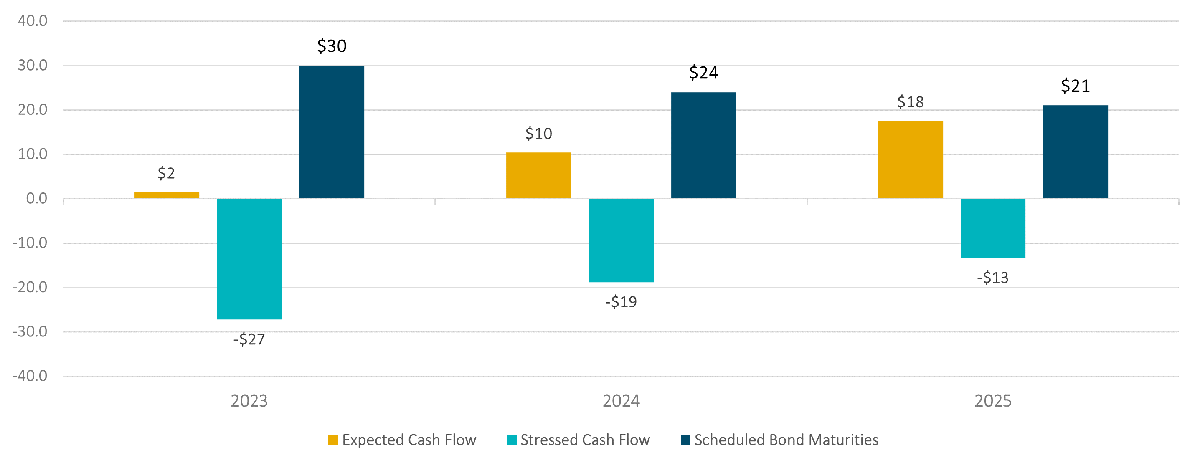
Fortunately, we’ve seen very few clients in that forced seller group, and that’s the function of working with those clients to ensure that their portfolio maturity structure is aligned with their liabilities in a way to provide a consistent amount of cash flow each year to cover higher than expected claims activity. This type of exercise is an important part of assessing how much duration risk a company can take.
Figure 5. Stochastic Illustrative Cash Flow Analysis to Ensure Bond Maturities Cover Higher-Than-Expected Claims6
Alternative Investments Continue to Generate Increased Interest
Prior to the recent spikes in rates, alternative asset classes such as private credit and real estate were generating increased interest from insurance company investors in their search for yield, particularly given what the market was compensating investors for buying traditional fixed income securities. While we believe yields in core fixed income are now much more attractive, these alternative asset classes continue to offer additional spread and enhanced expected returns.
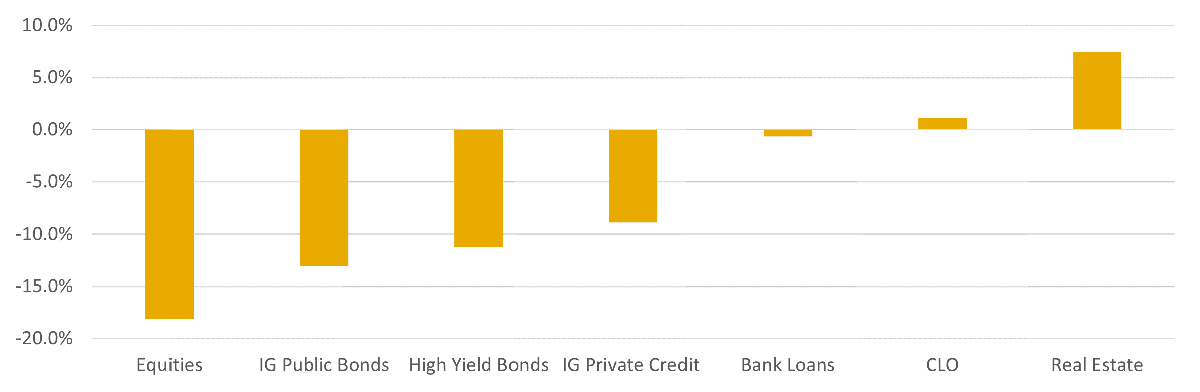
Insurance companies are getting increasingly more comfortable with the perceived risk and complexity associated with these investments. An important part of this evolution is utilizing strategic asset allocation analysis to better understand the impact on expected overall risk/return from adding alternatives to a portfolio, including their diversification benefits and downside protection features that help during recessionary periods. Looking at asset class returns in 2022, the lack of correlation to traditional insurance investments played out to the benefit of more diversified portfolios.
Figure 6. Alternative Investments Offered Non-Correlated Returns in 20227
Based on conversations with clients and prospects, we believe we are in the early innings in the trend toward increasing allocations to alternative asset classes.
Increasing Regulatory Scrutiny
The push into nontraditional investments has continued unabated despite likely changes in the capital treatment and reporting of these investments in insurance company portfolios. Over the years, product innovation has resulted in the creation of complex vehicles and structures that qualify for the same favorable ratings and capital charges as simpler bonds despite potentially holding greater risk.
As a result, regulators are planning on making changes to capital charges, reporting requirements, and definitions in order to improve transparency and better align the investments with their underlying risk. Included among recent National Association of Insurance Commissioners proposals are:
- Refining the definition of a bond with an eye toward properly classifying and reporting structured securities, including rated notes;
- Revising capital charges assigned to CLOs to eliminate capital arbitrage; and
- Re-examining the quality of private credit ratings from certain rating agencies.
Key takeaways:
- The Fed’s aggressive rate hiking campaign has resulted in a window for insurance investors to lock in attractive yields.
- Compared to a year ago, expected returns on fixed income look much more attractive relative to equities.
- Alternative fixed income investments continue to generate increased interest from insurers given their enhanced yields and expected returns, diversification benefits, and downside protection features.
- With the growth in nontraditional assets, insurers need to keep an eye on regulatory developments aimed at improving transparency and better aligning investments with their underlying risk.
Disclosures
This document is intended for institutional investors only. It is not for retail use or distribution to individual investors. The information in this document is not intended to provide specific financial, tax, investment, insurance, legal or accounting advice and should not be relied upon and does not constitute a specific offer to buy and/or sell securities, insurance or investment services. Investors should consult with their professional advisors before acting upon any information contained in this document.
Sun Life Capital Management (Canada) Inc. is a Canadian registered portfolio manager, investment fund manager, exempt market dealer and, in Ontario, a commodity trading manager. Sun Life Capital Management (U.S.) LLC is registered with the U.S. Securities and Exchange Commission as an investment adviser and is also a Commodity Trading Advisor and Commodity Pool Operator registered with the Commodity Futures Trading Commission under the Commodity Exchange Act and Members of the National Futures Association. In the U.S., securities are offered by Sun Life Institutional Distributors (U.S.) LLC, an SEC registered broker-dealer and a member of the Financial Industry Regulatory Authority (“FINRA”). BentallGreenOak, InfraRed Capital Partners (InfraRed), Crescent Capital Group (Crescent) and Advisors Asset Management (AAM) are also part of SLC Management.
BentallGreenOak is a global real estate investment management advisor and a provider of real estate services. In the U.S., real estate mandates are offered by BentallGreenOak (U.S.) Limited Partnership, who is registered with the SEC as an investment adviser, or Sun Life Institutional Distributors (U.S.) LLC, an SEC registered broker-dealer and a member of the Financial Industry Regulatory Authority (“FINRA”). In Canada, real estate mandates are offered by BentallGreenOak (Canada) Limited Partnership, BGO Capital (Canada) Inc. or Sun Life Capital Management (Canada) Inc. BGO Capital (Canada) Inc. is a Canadian registered portfolio manager and exempt market dealer and is registered as an investment fund manager in British Columbia, Ontario and Quebec.
InfraRed Capital Partners is an international investment manager focused on infrastructure. Operating worldwide, InfraRed manages equity capital in multiple private and listed funds, primarily for institutional investors across the globe. InfraRed Capital Partners Ltd. is authorized and regulated in the UK by the Financial Conduct Authority.
Crescent Capital Group is a global alternative credit investment asset manager registered with the U.S. Securities and Exchange Commission as an investment adviser. Crescent provides private credit financing (including senior, unitranche and junior debt) to middle-market companies in the U.S. and Europe, and invests in high-yield bonds and broadly syndicated loans.
AAM is an independent U.S. retail distribution firm that provides a range of solutions and products to financial advisors at wirehouses, registered investment advisors and independent broker-dealers.
The information provided is intended for informational purposes only and represents the views and opinion of the author(s), which may differ from those of other investment teams at SLC Management and its affiliates.
The material does not consider the suitability or needs of any person or entity, and is not a recommendation in any asset class or strategy. Diversification and asset allocation do not protect against loss nor guarantee returns.
Any financial indices referenced as benchmarks are provided for illustrative purposes only. The use of benchmarks has limitations because portfolio holdings and characteristics will differ from those of the benchmark(s), and such differences may be material. You cannot make a direct investment in an index. All referenced indexes are shown for illustrative purposes only. Factors affecting portfolio performance that do not affect benchmark performance may include portfolio rebalancing, the timing of cash flows, credit quality, diversification, and differences in volatility. In addition, financial indices do not reflect the impact of fees, applicable taxes or trading costs which reduce returns. No representation is being made that any investor will or is likely to achieve profits or losses in any asset class described or based on any benchmark. Past performance is not necessarily indicative of future results.
The information provided may present materials or statements which reflect expectations or forecasts of future events. Such forward-looking statements are speculative in nature and may be subject to risks, uncertainties and assumptions and actual results which could differ significantly from the statements. As such, do not place undue reliance upon such forward-looking statements. Any hypothetical data provided is for illustrative purposes only and does not represent actual client portfolios.
Efforts have been made to ensure that the information contained in this report is obtained from sources believed to be reliable and accurate at the time of publication. However, SLC Management does not guarantee its accuracy or completeness. All, opinions, commentary and information are subject to change and SLC Management accepts no responsibility for any losses arising from any use of or reliance on the information provided herein. SLC Management does not provide tax, legal or investment advice and the information within does not consider the reader's investment objectives or needs. Investors should consult a professional based on their unique situation. All opinions and commentary are subject to change without notice and are provided in good faith without legal responsibility.
Unless otherwise stated, all figures and estimates provided have been sourced internally and are as of June 30, 2023.
1. Bloomberg. Total returns for historical time periods 1977–2022. Bond performance measured by Bloomberg US Aggregate Bond Index; stock performance measured by S&P 500 Index. Assumes reinvestment of dividends.
2. Insurance Information Institute. Data as of 12/31/2020.
3. Bloomberg.
4. Return expectations based on an analysis of the current risk free rate as of the end of Q1 2022 versus spreads characteristic of the core fixed income benchmark, or the benchmark of another asset class, over a 3–5-year economic cycle.
5. Source: Bloomberg and SLC Management, as of March 31, 2023. Expected returns been based on SLC Management’s analysis of the current risk-free rate as of the end of Q1 2023 versus spreads characteristic of asset class benchmarks over a 3–5-year economic cycle. Proxy benchmarks used: Bloomberg US Aggregate (U.S. core bonds), JP Morgan CLO Index-Blend (IG collateralized loan obligations [CLO]), Morningstar LSTA US Leveraged Loan Index (leveraged loans), Bloomberg US Corporate High Yield Index (high yield [HY] bonds), NCREIF Property Index (real estate equity), S&P 500 Index (U.S. equity), Bloomberg EM USD Aggregate Index (emerging markets [EM] debt), S&P Listed Private Equity Index (private equity), LPX Mezzanine Index (mezzanine debt) and SLC Management internal data (intermediate investment grade [IG] private credit, narrowly syndicated credit, direct lending, commercial mortgages, value add real estate [RE] debt). Implied volatility measured by the annualized historical standard deviation of the asset class since the inception date of its corresponding benchmark. Please refer to benchmark disclosures at the end of this document.
6. Source: Illustration based on a stochastic SLC Management financial model with varying underwriting and investment assumptions. Stressed cash flow is produced by running simulation and selecting the 90th percentile worst outcome. No undue reliance should be place on this information.
7. Source: Bloomberg, 2022. Total returns based on the following indexes: S&P 500 Index (equities), Bloomberg Aggregate Bond Index (investment grade [IG] public bonds), ICE BofA US High Yield Index (high yield bonds), Stonecastle Intermediate Investment Returns (IG private credit), Morningstar LSTA US Leveraged Loan Index (bank loans), J.P. Morgan Collateralized Loan Obligation Index (collateralized loan obligations [CLOs]) and Open End Diversified Core Equity (ODCE) Index (real estate).