But fiscal and monetary remedies, tight labor markets, stretched supply chains, and war in Europe have pushed inflation to a 40- year high. The Federal Reserve, which in late-2021 characterized inflation as “transitory,” has responded with a two-pronged attack. They are hiking interest rates while signaling many rate increases to come. They are also shrinking the bloated balance sheet.
Long-term rates have dutifully jumped in response to the Fed’s move, although not enough to prevent an inversion of the yield curve, signaling a potential economic slowdown ahead. A yield curve demonstrates the rates associated with government bonds of varying maturities, usually from short-term to long-term. An inverted yield curve occurs when short-term rates are higher than long-term rates. That can signal that investors believe that a recession is coming that will depress longer term interest rates. Historically, an inverted yield curve has been predictive of recessions; the most recent 10 recessions have occurred following an inverted yield curve.
For MPL carriers, an important question revolves around the commercial property market and how that market will respond to the economy going forward.
1970-80s Economic Redux?
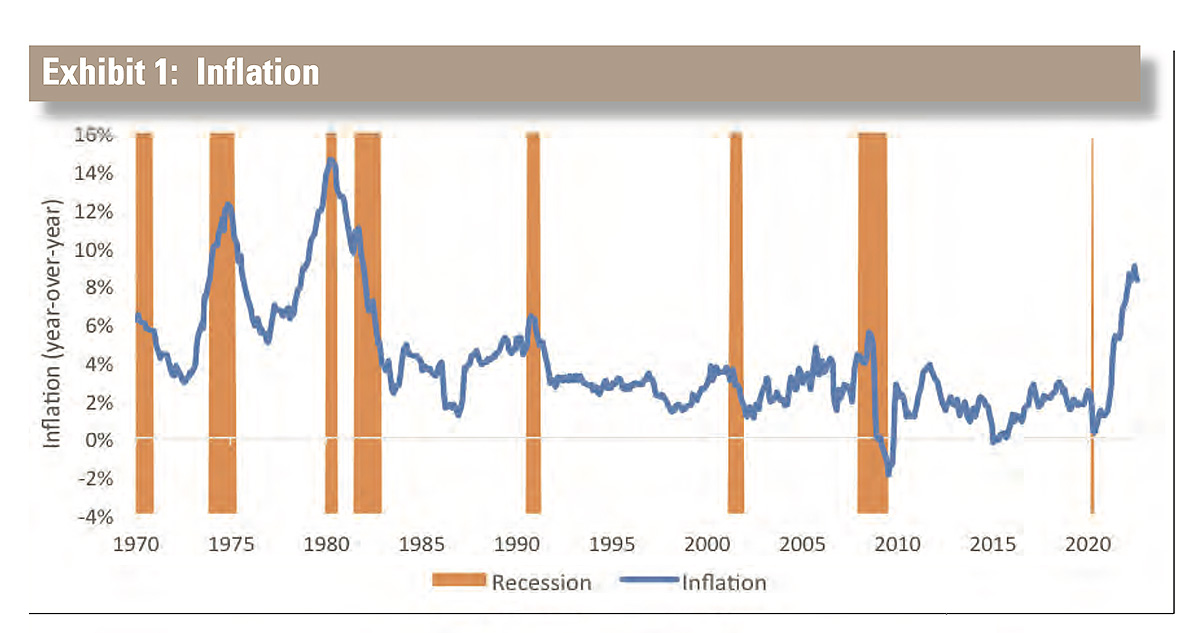
The rapidly shifting financial environment may seem unprecedented to most experienced investors. But we have been here before. Indeed, recent events are reminiscent of another tumultuous period in U.S. economic history: The “stagflation” period from 1974 to 1984 (see Exhibit 1):
- War: the Vietnam War ended 1975
- Monetary policy laxity after the gold standard was abandoned in 1971
- Oil shocks in 1973 and 1979,
- Spiraling inflation, which peaked at 15% in 1980
- Surging interest rates with 10-year Treasuries topping 15% in 1981
Economic growth, though reasonably buoyant overall—averaging 3% annually—was extraordinarily volatile. During this period there were four recessions, averaging one every three years, compared with one every nine years in the four decades since.
The analogy is not perfect. The U.S. was arguably more vulnerable to inflation back then: the economy’s energy intensity and union membership were more than double what they are today. After 30 years of relative price stability, businesses and workers may be deeply conditioned to expect more of the same, reducing the risk of a wage-price spiral.
It is also possible that the Federal Reserve will act more quickly and forcefully to reduce demand, or that geopolitical and other catalysts will abate on their own. But as Mark Twain is reputed to have said, “History does not repeat itself, but it often rhymes.” It is in this spirit that we look to the 1970s for clues about what to expect from real estate in the coming years.
Impact on the Commercial Real Estate Market
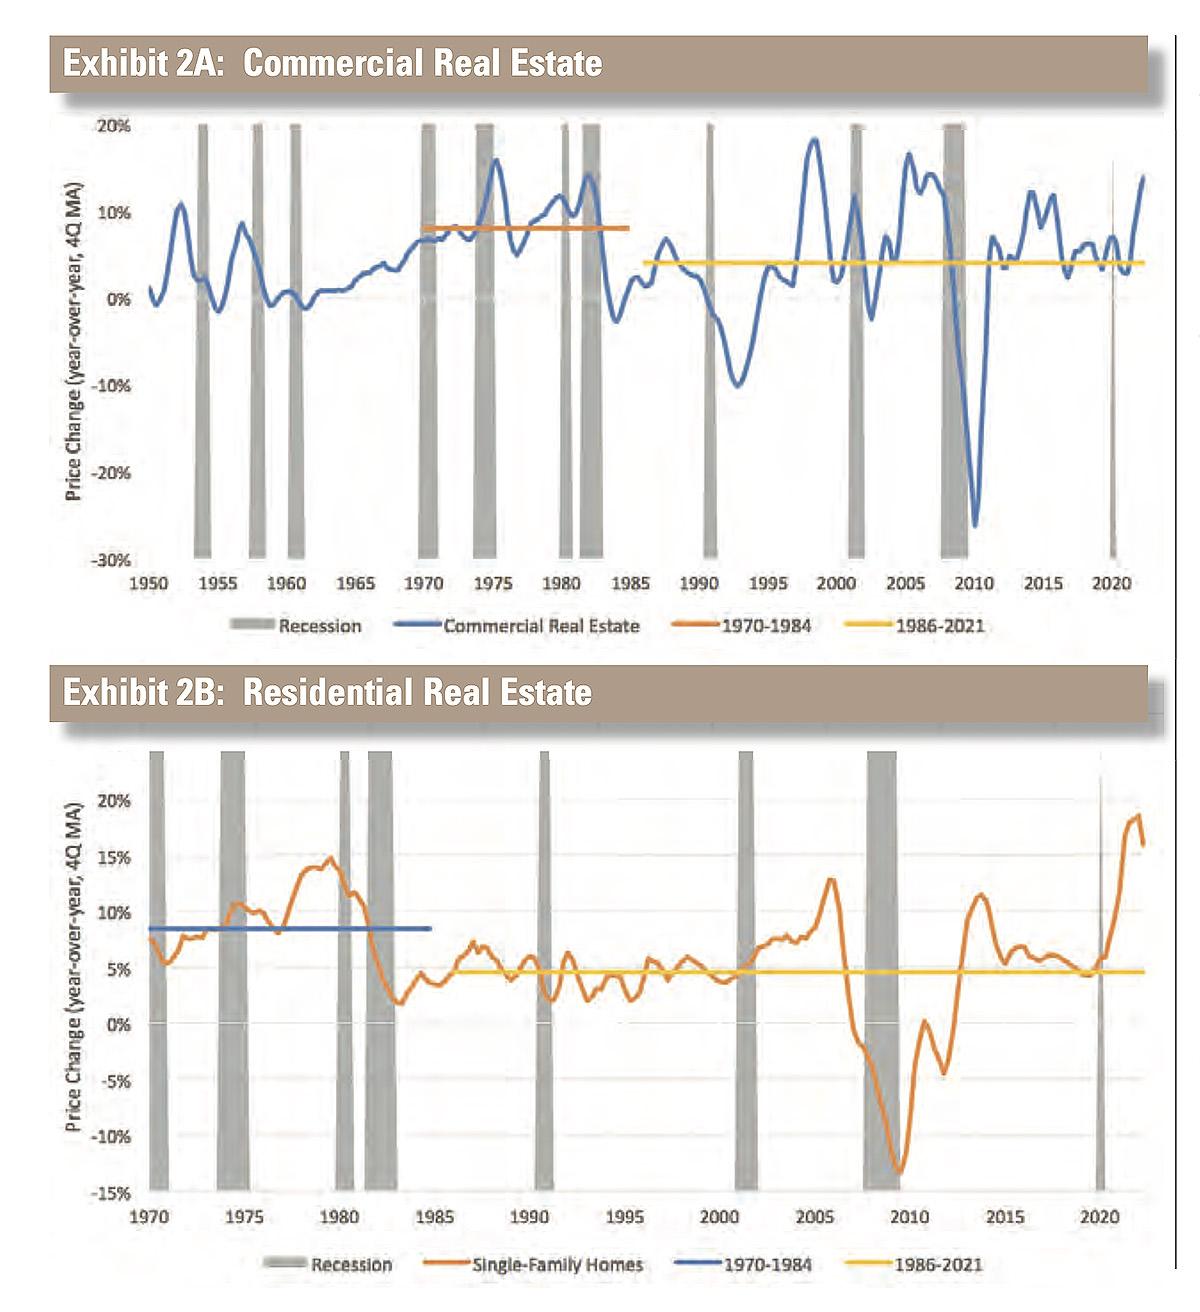
The good news is that despite war, inflation, high interest rates, and economic volatility, the 1970s were quite good for U.S. commercial real estate (see Exhibit 2A and B). History shows that price corrections have always been triggered by recessions, although their magnitude have been influenced by other factors, such as supply and financial conditions. Yet the reverse has not always been true: Not all recessions have caused prices to fall.
Before the COVID recession, which might have passed too quickly to register in real estate valuations, the notable exceptions were the three recessions of the 1970s and early 1980s. True, real estate eventually capitulated after the second leg of the 1980s “double-dip.” But the pullback was mild: 3.5%, only a tenth of the Global Financial Crisis slump.12 From 1970 to 1984, real estate prices increased 8% annually, double the average of the past 35 years.13 Cap rates are not available for most of the 1970s, but assuming they were roughly in line with 1980 levels—8%—total returns would have averaged about 15% annually from 1970-1984, compared with 9% for large-cap stocks and 7% for long-term Treasuries.14 On the residential side, growth in single-family home prices remained positive throughout, even as fixed-rate mortgage rates pierced 18% in 1981.
How could real estate prove so resilient? The historical record does not provide visibility into underlying dynamics, such as vacancies, rents, or cap rates. However, it is possible to draw inferences based on theory and economic circumstances at the time.
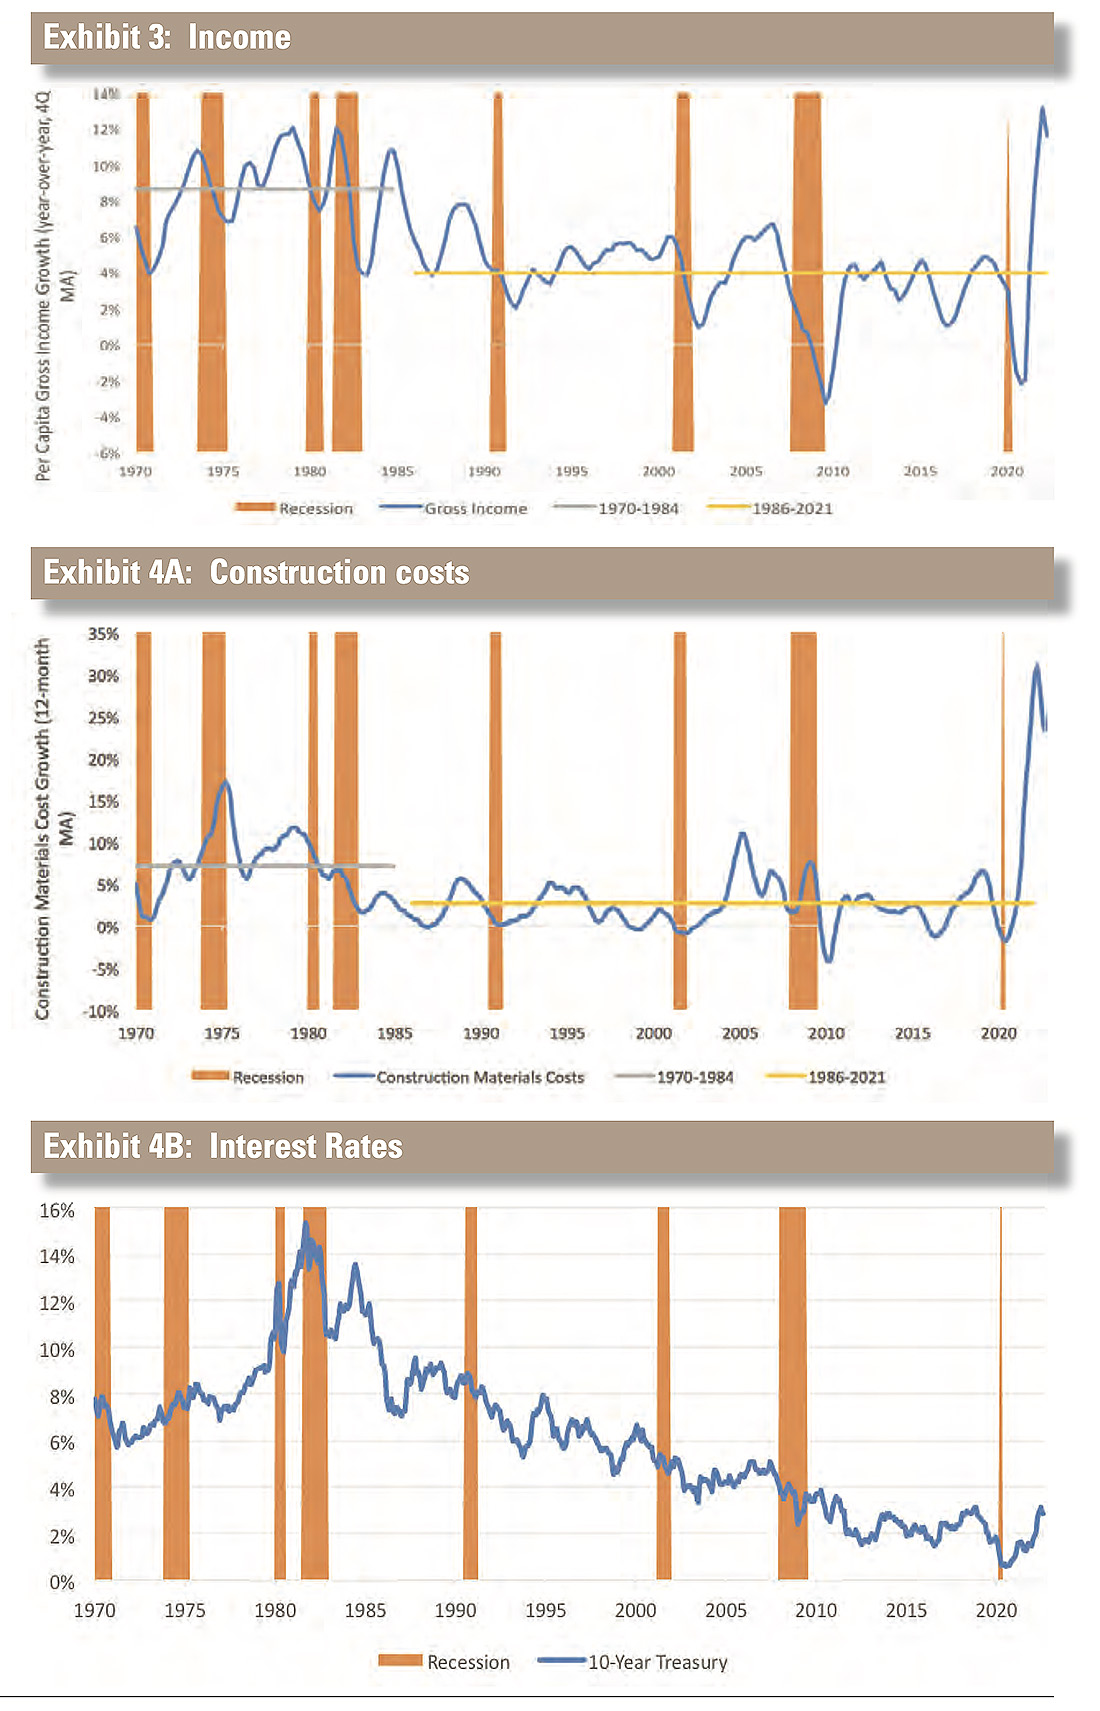
First, per capita incomes increased sharply; they oscillated around recessions, but averaged 8.6% annually over 15 years (see Exhibit 3). Although this may seem counterintuitive given the turbulent economy as the unemployment rate increased from 3.9% in 1970 to 10.8% in 1982, it was inherent to systemic inflation: While many people were out of work, the lucky ones who were employed won sizeable pay hikes, both driving due to higher costs and allowing because of higher household incomes, companies to increase prices. Rising revenue and wages may have lifted commercial and residential renters’ ability and willingness to pay higher rents.
Second, inflation pushed up construction costs (see Exhibit 4A and B). Interestingly, commercial and residential development progressed at a healthy pace, averaging about 1.5% of GDP from 1970-1984, compared with 1.0% in 2021. However, new projects surely demanded higher rents to compensate for rising costs, which renters were willing and able to absorb as incomes increased. It would be reasonable to assume that higher market rents and replacement costs lifted the values of existing assets.
But what about cap rates? Evidence is limited, but the earliest data suggests that real estate yields averaged 8% in 1981 at a time when yields on 10-year Treasuries were 15%.19 Why would investors accept a lower yield on property, subject to leasing and other risks, than on liquid, “risk-free” government bonds? The reason is straightforward: Whereas Treasury coupons and principal were fixed, real estate rents and values were not. In theory, cap rates are a function of interest rates (+), a risk premium (+), and expected rent growth (-). Investors might have calculated that high interest rates were a corollary to high inflation, which would feed into stronger rent growth—neutralizing any upward pressure on cap rates.
Economic Parallels
The economic landscape today betrays striking parallels to the 1970s. Per capita income and average wages increased 11% and 7% year-over-year, respectively, in June 2022. The cost of construction materials jumped nearly 9% year-over-year in August and were up nearly 50% since pre-COVID. Interest rates are rising quickly. The economy is strong— unemployment is near pre-crisis lows—yet an inverted yield curve hints at potential volatility ahead.
Investment advisors caution that “past performance does not guarantee future results.” It is unlikely that the 2020s will mirror every twist and turn of the 1970s. Moreover, real estate’s apparent resilience should be taken in perspective. Price gains from 1970 to 1984 were less impressive after adjusting for inflation—values barely increased in real terms.
Finally, although index numbers are comforting, they obscure vulnerabilities beneath the surface. In the coming years, real estate may be prized more for its inflationary growth than for its yield, particularly if interest rates eclipse cap rates.
This shift in financial profile may create instability, as investors with different risk and return objectives, as well as financing structures, react differently to this apparent trade-off. Moreover, if real estate’s resilience is predicated on its ability to generate higher rents, what will happen to buildings occupied on long-term leases at fixed— or nearly fixed—rental rates? And if the next decade is marked by economic volatility, could more frequent recessions undermine occupancies? In short, Inflation 2.0 could bring as many tailwinds as headwinds, but that could still make for a bumpy ride.
References
1 Bureau of Labor Statistics. As of August 2022.
2 FOMC Statements. November 2, 2021 and September 21, 2022.
3 Federal Reserve (yield curve). As of September 2022.
4 “An inverted yield curve: why investors are watching closely,” FinancialTimes.com, April 6, 2022, https://ig.ft.com/the-yieldcurve-explained/
5 “What the Heck is An Inverted Yield Curve? And Why Does It Predict A recession?” Forbes.com, Sept. 11, 2022, https://www. forbes.com/sites/qai/2022/09/26/what-the-heck-is-an-invertedyield-curve-and-why-does-it-predict-a-recession/?sh= 133eb5da3eb6
6 “An inverted yield curve: why investors are watching closely,” FinancialTimes.com, April 6, 2022, https://ig.ft.com/the-yieldcurve-explained/
7 “What the Heck is An Inverted Yield Curve? And Why Does It Predict A recession?” Forbes.com, Sept. 11, 2022, https://www. forbes.com/sites/qai/2022/09/26/what-the-heck-is-an-inverted-yield-curve-and-why-does-it-predict-a-recession/?sh=133eb5 da3eb6
8 Bureau of Labor Statistics (consumer price index); Federal Reserve (10-year Treasury yield). As of September 2022.
9 Bureau of Economic Analysis (GDP); National Bureau of Economic Research (recessions). As of September 2022.
10 U.S. Energy Information Administration (energy intensity); Bureau of Labor Statistics (union membership). As of December 2021.
11 Federal Reserve (commercial real estate prices); National Bureau of Economic Research (recessions). As of June 2022.
12 Federal Reserve (commercial real estate prices). As of June 2022.
13 Federal Reserve (commercial real estate prices). As of June 2022.
14. Ibbotson SBBI US Large Cap Stocks (large cap stocks); Ibbotson SBBI US Long-term (20-Year) Government Bonds (Treasuries). As of June 2022.
15 National Association of Realtors (median single-family home prices); Freddie Mac (30-year Fixed Rate Mortgage). As of August 2022.
16 Bureau of Economic Analysis (income growth). As of June 2022.
17 Bureau of Labor Statistics (unemployment rate). As of June 2022.
18 Bureau of Economic Analysis. As of August 2022.
19 NCREIF (cap rate); Federal Reserve (10-year Treasury yield). A of June 2022.