In several respects, 2024 was a continuation of trends witnessed in 2023 for the MPL industry. Direct written premium continued modestly increasing, the combined ratio remained virtually unchanged, moving up in proportion to a minor decrease to prior-year reserve releases, and policyholder dividends remained consistent. Investment performance improved again and surplus increased further, leading to what might be considered a slightly better year for the MPL industry in 2024 when compared to 2023.
Reported frequency remains below the reported frequencies observed in 2020 and prior and even decreased slightly relative to 2023. Despite continued favorable frequency indications, the combined ratio for the composite remained above 100%. Even though the composite experienced an underwriting loss for the ninth consecutive year, balance sheets are as strong as ever, and the composite again provided policyholders with dividend payments in 2024.
After a brief decrease in surplus for the composite in 2022 due to unrealized capital losses, surplus for the composite has increased by around 5% for back-to-back years. Although the courts now appear to be running at capacity and total MPL payments continue to rise, unpaid claim liabilities have also increased for the ninth consecutive year.
Low claim frequency continues to aid the composite’s results. However, frequency has been relatively stable for a few years now, which raises the question of whether a floor has been reached.
As we noted last year, severity levels also moderated during the pandemic, following years of increased severity due to the disproportionate impact of large claims. It was our assumption that this pause in increasing severity was driven by pandemic-related court closures and other court-related slowdowns. In other words, the temporary flattening of severity was likely driven by the types of claims being settled. There was little evidence to suggest severity declines should be expected in the future, with economic inflation, social inflation, and the continued erosion of tort reforms each applying upward pressure on future severity.
With carriers continuing to work through their open claim inventory, the types of claims closed in 2024 tended to be older than history would have suggested. The data shows that for the second consecutive year, payments exceeded what a long-term trend would suggest. Furthermore, these “excess” payments have yet to “fill in” the hole caused by reduced payment activity post-COVID.
We have based this picture of the current state of the MPL industry on the financial results of a composite of 69 of the largest specialty writers of MPL coverage. Using statutory data obtained from S&P Global Market Intelligence as well as additional data from Milliman Datalytics-Defense, we have compiled financial metrics for the industry based on:
- Written premium
- Reserve releases
- Overall operating results
- Capitalization
- Policyholder dividends
In considering the financial results, note that the 69 companies included in the metrics are all established MPL specialty writers. The composite excludes any MPL specialty writer that has become insolvent or otherwise left the market as well as multi-line commercial writers and smaller writers. The companies in each of these three excluded categories are generally not capitalized as well as the 69 companies included here. In addition, the underwriting results of the multi-line commercial writers, along with some of the smaller writers, have generally been less profitable. Of course, this is also true for the writers that became insolvent. Thus, the results presented below reflect the experience of the established specialty writers, which tends to be more favorable than a view of the whole industry.
Written Premium
During 2024, the composite’s direct written MPL premium added 2.4%, pushing total volume over $5.3 billion—its highest mark to date (Figure 1).
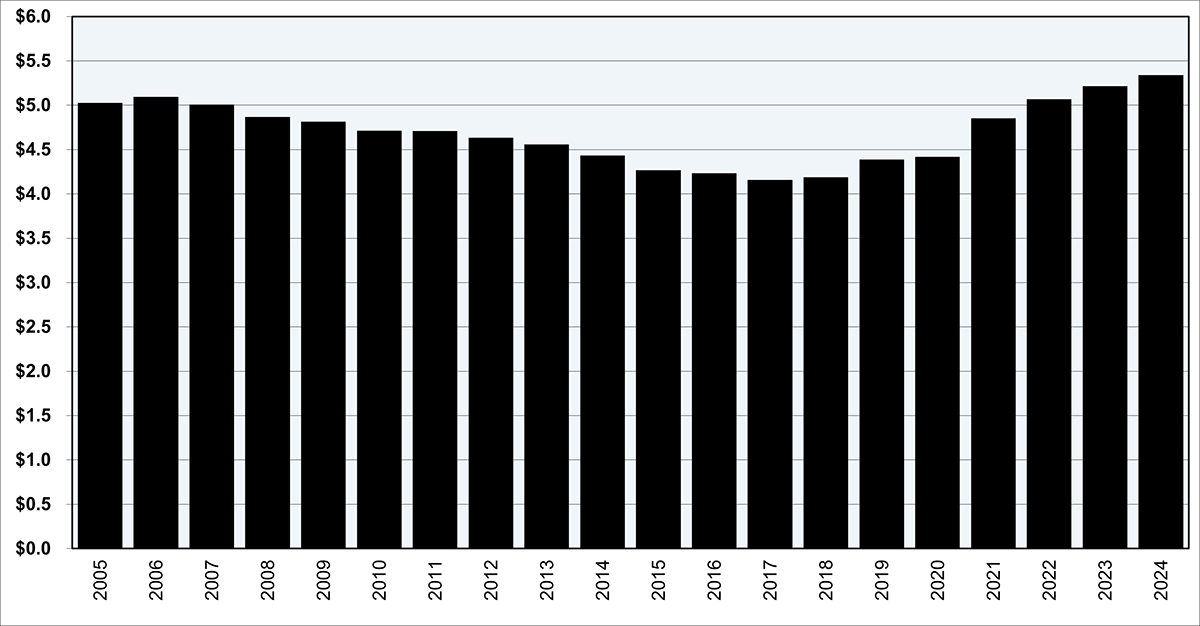
The rate of growth fell for the third consecutive year from a high of 9.9% growth in 2021. This lower level of premium growth is somewhat inconsistent with the rate changes compiled by Medical Liability Monitor, which saw higher levels of rate action taken during the 12 months ending July 1, 2024 than the prior 12-month period. These differences may be attributed to a greater degree of mid-sized companies in this composite relative to Medical Liability Monitor’s analysis and/or changes to the non-manual rate changes deployed.
The distribution of direct written premium for the composite continues to gravitate away from physician premium and into hospitals, other professionals, and other facilities. In 2024, physician premium represented 69% of the composite’s MPL direct written premium, while premium for hospitals, other professionals, and other facilities comprised about 17%, 11%, and 3%, respectively. Yet, a decade ago, physician premium stood at 80% of the composite, whereas hospitals, other professionals, and other facilities held only 10%, 9%, and 1%, respectively. This demonstrates a shift in terms of which parties shoulder MPL risk. This trend underscores the industry’s evolving premium landscape and continued transfer to physicians employed in a hospital setting.
Reserve Releases
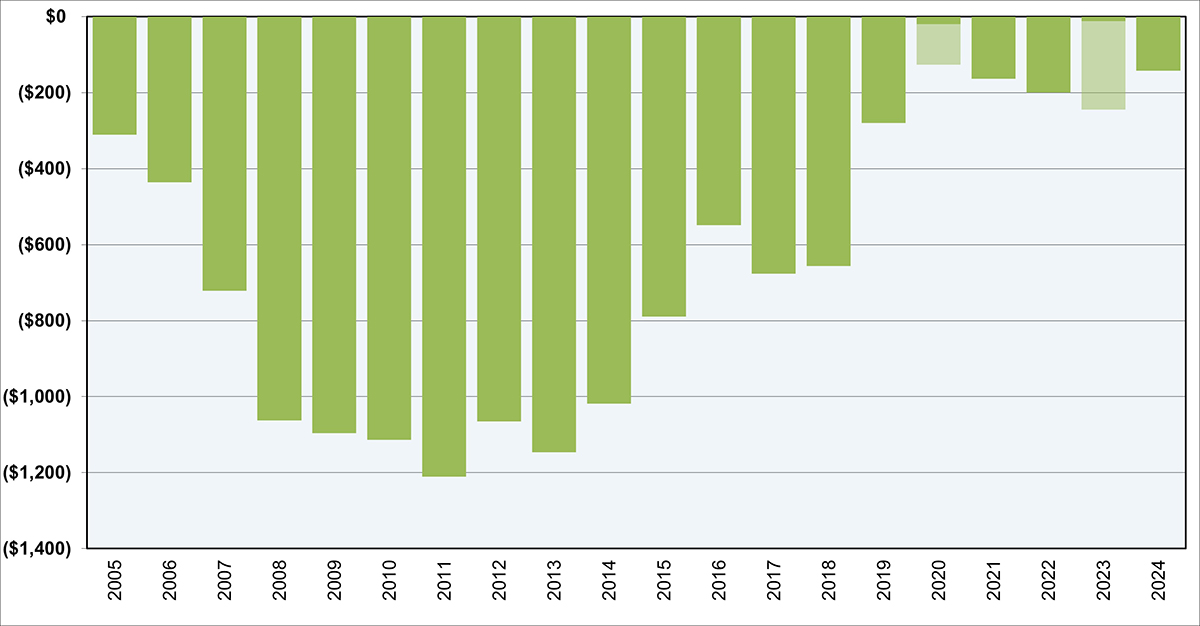
The composite released about $140 million in prior year reserves during 2024. This marks a reduction in reserve releases relative to 2023, after removing the impact of a large acquisition, for which the accounting treatment of the transaction distorted the prior year reserve release as stated in Schedule P, Part 2. There was also an acquisition in 2020 that was accounted for similarly, and the impact of both transactions is shown by the light green portion of the bars in Figure 2. 2024 is the sixth consecutive year of reserve releases of approximately $100 million to $200 million, perhaps indicating a “new normal.” From 2007 through 2018, the composite’s lowest reserve release had been $500 million, with an average reserve release approaching $1 billion.
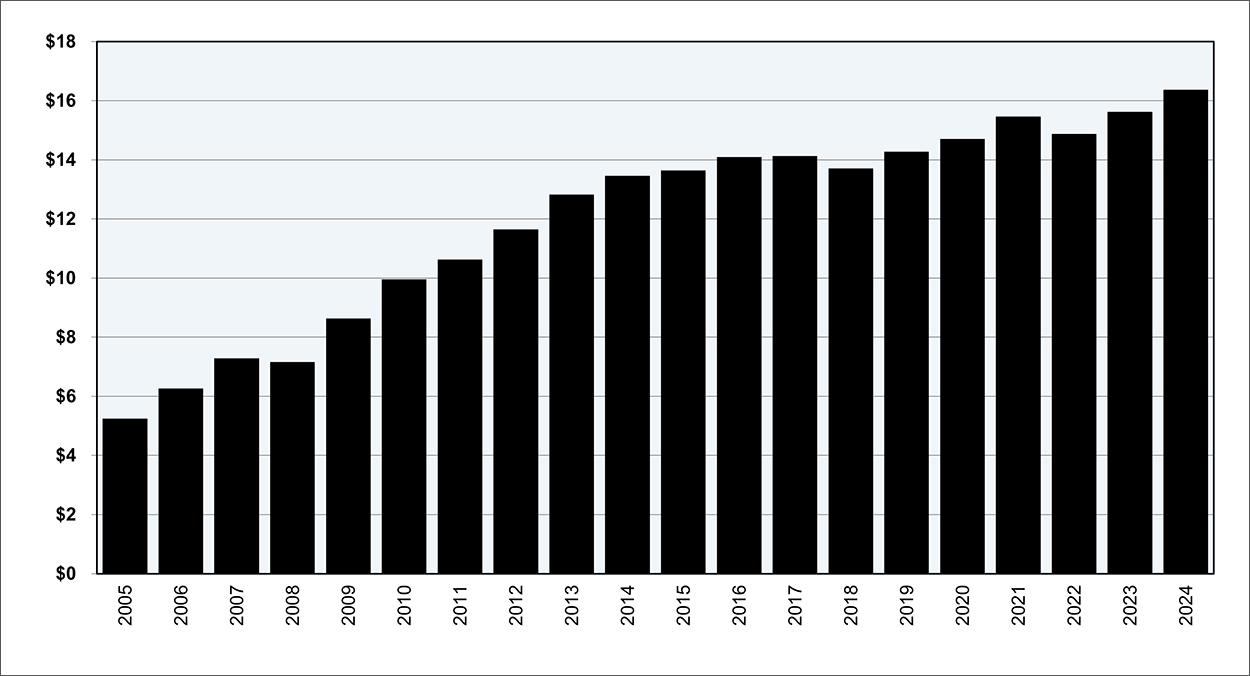
While the prior year reserve releases in recent years have moderated relative to reserves released from the decade prior, the composite’s unpaid loss and loss adjustment expense (LAE) reserves have increased. Since 2020, loss and LAE reserves have increased by about 17% to over $15 billion in 2024. This is despite what appears to be a declining number of open claims, based on a review of Schedule P, Part 5 data, which shows a 5.5% decrease in open claims during the same period. This implies a year-over-year increase in average unpaid severity of 4.5%. This may be related to social inflation, lingering effects of COVID-related litigation delays, or something else. What we can do is analyze the COVID-related impact in greater detail.
Similar to past years, we can see the impact of the pandemic on the courts by observing the average trial attendance and travel hours per open claim invoiced by attorneys (Figure 3). Using a proprietary database containing, on average, 25,000 open claims at any given time over the last five years, we observed trial hours near-zero for almost 12 months across 2020 and the beginning of 2021.1
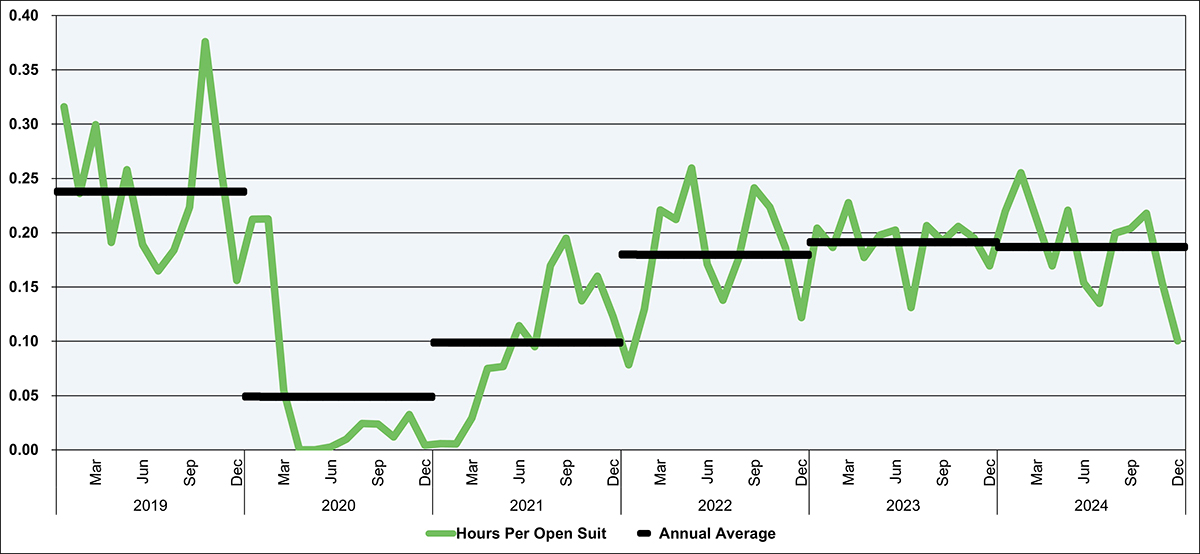
Those hours gradually began to rise beginning in March of 2021, and since then they have recovered and reached an apparent equilibrium. The reduction in trial hours during 2020 and 2021 appears to directly impact the ability of insurers to close claims, which led to fewer payments during 2020 and 2021 throughout the industry, as described in prior articles.
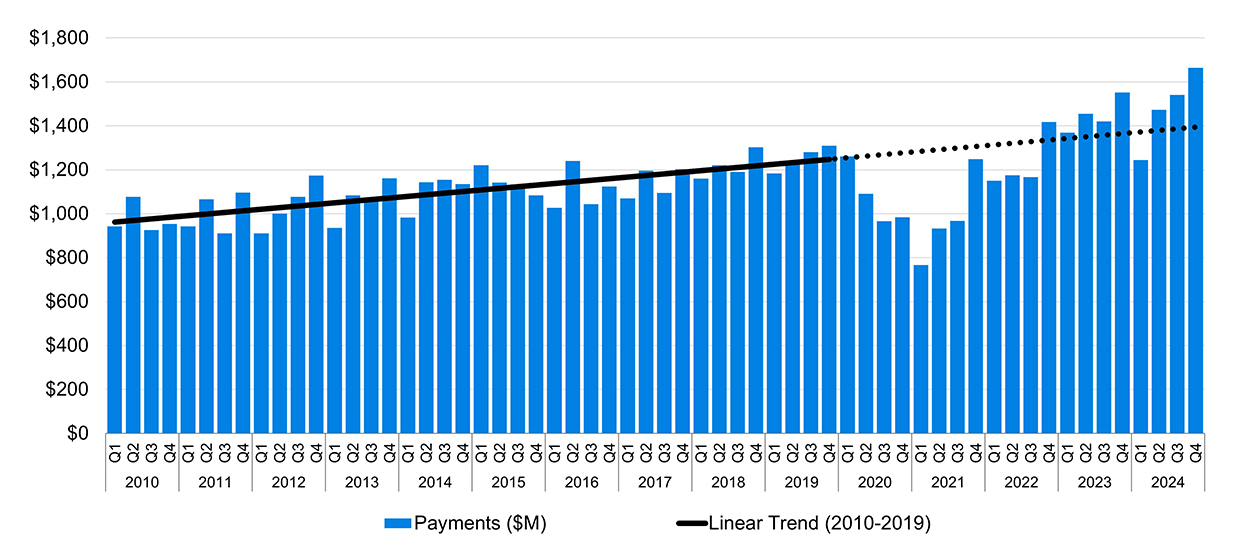
Trial hours and NAIC Quarterly Statement payment data appear to be positively correlated. Between 2019 and 2021, payments fell sharply due in part to the COVID-related court slowdowns and closures; however, payments made since the fourth quarter of 2022 have been consistently greater than what the long-term trend would indicate. This is another sign that insurers are working through the backlog of their open claim inventory (Figure 4).
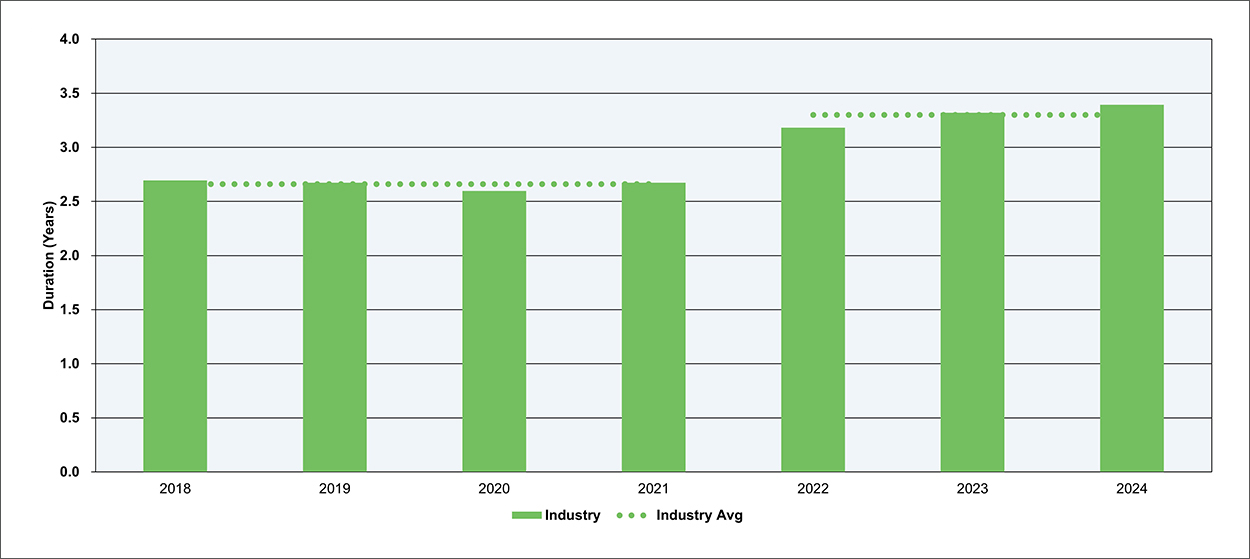
These delays have caused the average duration (defined as the time from report date to close date) for claims closed during 2022 through 2024 to increase by nearly 25% when compared to those claims that closed between 2018 and 2021 (Figure 5). However, this same metric shows that during 2024, the open claim duration has begun to decline again, meaning that the closed duration may soon follow.
This data, from the same proprietary database, contains an average of over 12,000 closed claims per year. The COVID-related slowdowns not only caused reserves to be held longer but also may have resulted in higher claim severities for both indemnity and defense costs, leading to the increase in carried reserves and the recent elevated loss payments.
Overall Operating Results
The 2024 operating ratio improved by approximately two points compared to 2023, which was driven by a three-point improvement in investment income (Figure 6). The calendar year loss and LAE ratio, underwriting expense ratio, policyholder dividend ratio, and realized capital gains ratio all remained relatively flat. This is the third time out of the last four years in which the operating ratio has improved (there was a one-year deterioration from 2021 to 2022).
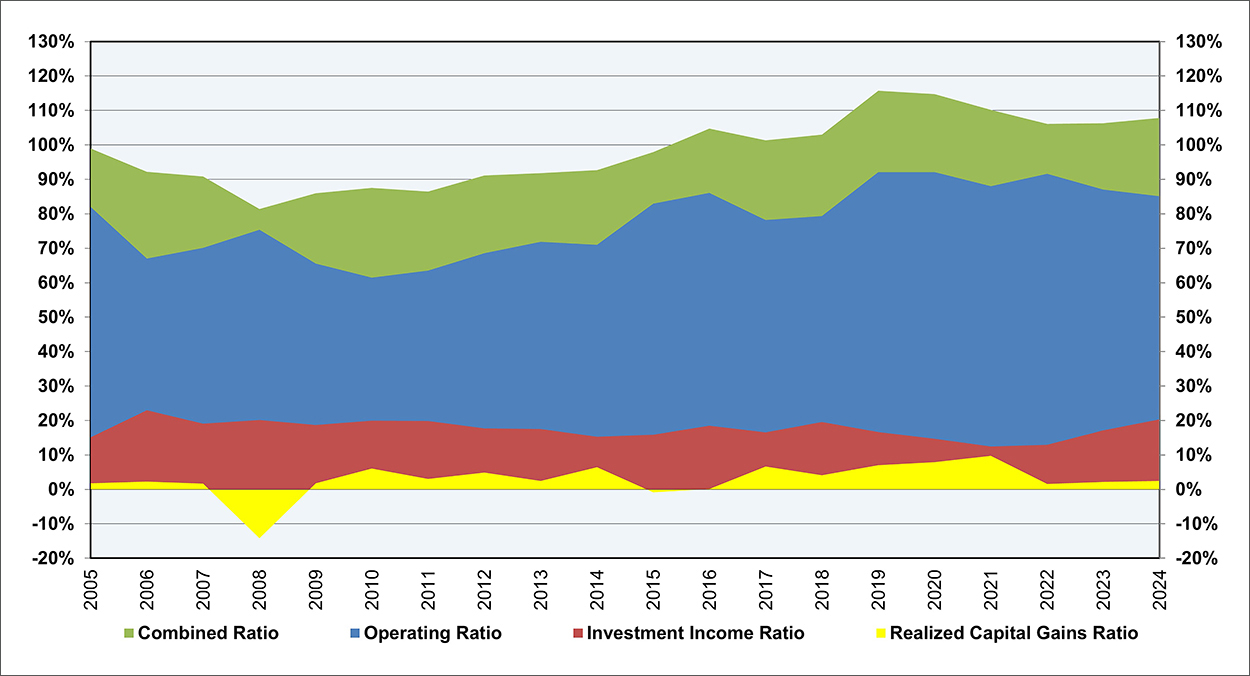
As mentioned previously, after adjusting for a large acquisition, reserve releases have remained relatively flat since 2019. The approximately 3.5% benefit to the operating ratio during the last five years remains significantly lower than the double-digit percent releases of 2007 through 2018 that were oftentimes more than 20%. Combined ratios remain above 100%, and have since 2016, as seen in Figure 6. As such, the composite continues to rely on investment income for profitability.
The composite’s initial coverage year loss and LAE ratio declined from 84% in 2023 (after excluding the impact of the large acquisition mentioned previously) to 83% in 2024. The one-point improvement in coverage year loss and LAE ratio appears to be driven, in part, by a reduction in reported claims. Schedule P, Part 5 data shows 3% fewer reported claims through 12 months of development in 2024 relative to 2023. Keeping reported claim counts lower will be a critical aspect of trying to improve the combined ratio, and ultimately the operating ratio, in coming years. Although much of the focus in the industry of late has been on severity, and rightly so, widespread increasing frequency is something the industry has not seen in decades and would require a stronger approach to rate actions.
Capitalization
After a nearly four-point decrease to the composite’s policyholders’ surplus during 2022 due to unrealized capital losses, the composite quickly bounced back, recording consecutive $750 million increases (each about 5%) to policyholders’ surplus during 2023 and 2024 (Figure 7). A $725 million net income, besting 2023 by $120 million, was the primary driver of the surplus increase.
The composite’s capitalization, as measured by its risk-based capital (RBC) ratio remains strong relative to most other insurance segments, per results aggregated from S&P Global Market Intelligence. The RBC ratio provides a comparison of a company’s statutory surplus to the minimum amount needed from a regulatory perspective (although, from a practical perspective, the minimum amount of capital needed is well over this regulatory minimum). The RBC ratio for the composite increased by 100 points in 2024 to over 900%.
Policyholder dividends
Policyholder dividends for the composite were quite similar in 2023 and 2024, each coming in at around $140 million. This is roughly 50% lower than the average policyholder dividend paid by the composite between 2007 and 2018. Historically, these policyholder dividend payments were likely funded, in part, by the composite’s reserve releases, which, as mentioned previously, have dropped in recent years.
Yet, as a percentage of net income, dividends have remained relatively stable. From 2007 onwards, dividend payments to policyholders have consistently averaged 20%–25% of pre-dividend net income. 2024, however, was a light dividend year by this metric. 16% of pre-dividend net income was distributed to the composite’s policyholders, which represents the lowest dividend percentage since 2006. The number of companies providing dividends has declined by 40% in the last decade. One-quarter of the composite’s companies paid policyholder dividends in 2024.
What’s next?
As we move into 2025, the announced acquisition of ProAssurance by The Doctors Company has been the big news. This proposed acquisition represents the largest transaction in the industry since ProAssurance acquired NORCAL a few years ago. This evolving industry landscape is also seeing a variety of tort reform changes that continue to introduce complexities, with several states altering damage caps and litigation rules, potentially impacting claim frequencies and severities.
Despite these uncertainties, the MPL industry remains resilient and well-capitalized. The industry's recent improvements in operating ratios, primarily driven by investment income, highlight its adaptability and strength. However, the reliance on investment income for profitability underscores the ongoing challenge of achieving consistent underwriting gains.
As insurers navigate these dynamics, the strategic decisions made in response to legislative changes and market conditions will be critical. The industry's ability to adapt and innovate will determine its future trajectory, ensuring that it remains competitive and profitable in an ever-changing environment. Industry leaders will need to remain vigilant and proactive, as the road ahead promises to be both challenging and full of opportunity.
Reference
1 Database compiled and maintained by https://www.milliman-datalytics.com/