A surgical patient returns to the operating room within 30 days. Reviewed in isolation, this unremarkable clinical event is closed out quickly: The complication was recognized, the second procedure went well, and the outcome was acceptable. Nothing in the file suggests a claim.
Now consider the same clinical event as the 12th return to the operating room for one surgeon over the past 18 months, compared with a risk-adjusted peer group in which the expected number is four. Nothing about the individual event has changed. Instead, benchmarking the clinical event provides perspective on a troubling pattern of clinical practice. The shift from an individual event, or even a history of claims, to the rate at which risk-related events occur is where the next generation of malpractice underwriting will be won or lost.
Clinical Patterns Can Predict What Claims History Cannot
The law of large numbers is well known to underwriters and actuaries. No one can credibility-weight an individual physician based on zero or one claim over five years. Several hundred clinical encounters are a different matter. Because malpractice claims are (thankfully) infrequent, only clinical data provides the volume needed to satisfy the requirement for large numbers. Clinical data thus solves a long-standing statistical problem that claims data can barely touch.
Consider maternal birth trauma, defined as patients who give birth and experience a 3rd- or 4th-degree laceration. As expected, claim frequency rises with injury rates. Clinical measurement confirms that the vast majority of claims are driven by 40% of providers.
Figure 1
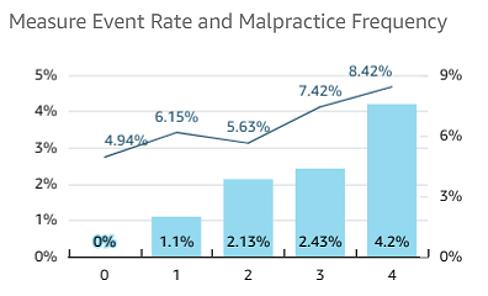
Maternal Birth Trauma: The percentage of patients who give birth and experience a 3rd- or 4th-degree laceration
Malpractice Is Not Random, and the First Event is Rarely the Signal
Using a large Florida malpractice database, researchers established decades ago that losses are heavily concentrated: Most insurer payments involved a relatively small number of physicians. These results were repeatable, as physicians with adverse claims experience from incidents between 1975 and 1980 went on to have worse experiences from incidents in 1981 through 1983. High risk in one period predicted high risk in the next.
Furthermore, the first event doesn’t indicate which physician may experience more incidents. Consider how often a patient new to opioids (“opioid-naïve”) is prescribed more than a three-day supply. When we group providers by how often this occurs and plot it against malpractice claim frequency, the results are unsettling for anyone relying on event-triggered review. Among the lowest 60% of providers (the bottom 3 groups in Figure 2), there is no meaningful difference in claim frequency. The top 40% is more likely to have a malpractice claim, and the top 20% is significantly more likely.
Overprescribing opioids is a prime example of a situation where the first several events are genuine noise. Any model that focuses only on the event trigger (a 3+ day opioid prescription) is looking for a signal that doesn’t yet appear, and worse still, the model can’t detect when behavior crosses into materially elevated exposure (the top 40% of 3+ day opioid prescriptions).
Figure 2
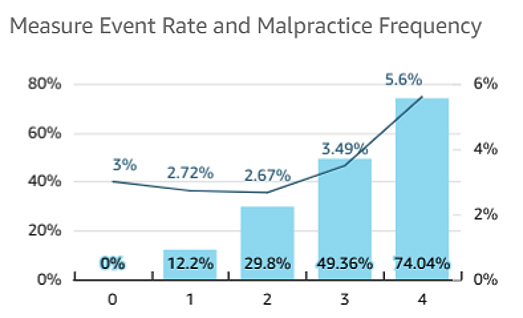
Opioid-Naïve Patients Given More Than a 3-Day Supply in the Emergency Department
What Risk Management Is Actually Measuring
When you ask a hospital system what it is doing about malpractice risk, the likely answer focuses on office safety and documentation. Grab bars in the right place. Consent forms executed. Charts completed and timely.
Although these safety measures and documentation are important and defensible, they don’t address physician practices linked to malpractice claims. That’s because clinical patterns are distinct from safety measures. The risk manager at a large system typically lacks a way to learn that one campus is running maternal laceration rates above its peer group or that a single obstetrician's rate has been climbing for six quarters. Quality and risk management teams need access to relevant, timely information to spot and address these patterns.
How does this issue in risk management reporting affect MPL underwriters? A hospital submission with strong safety measures and documentation can still overlook the exposures that drive severity claims. Like healthcare administrators, MPL underwriters need timely access to clinical data to detect patterns.
Benchmarking Makes the Clinical Pattern Visible
An organization that monitors only its own data serves as its own control group. Year-over-year stability in complication rates may seem reassuring, but it doesn’t tell the whole story. Such stability may mask markedly worse performance relative to its peers, particularly in complication rates, which are directly correlated with malpractice claims.
External benchmarking also reveals relationships that internal review would never consider. Take follow-up office visits after an emergency department encounter. When a patient sees their primary care provider following an emergency room visit, claims frequency drops sharply by 35%. Even routine care-coordination practices can reduce financial risk, challenging the typical assumption that only dramatic events drive claims.
Figure 3
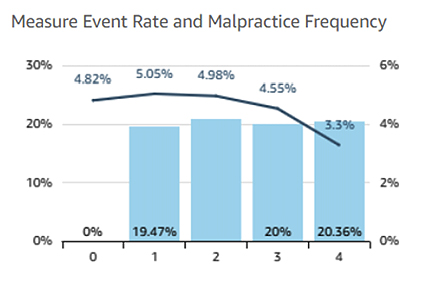
Patients who had a follow-up visit with a provider after any Emergency Department visit
Analyzing physician patterns over time also mitigates the issue with provider-level analysis, which penalizes physicians who take the hardest cases. Observed practice patterns enable MPL underwriters to compare apples to apples, provided the underlying rates are risk adjusted.
Getting Ahead of Severity
An unspoken concern about active surveillance is that it surfaces problems that then become discoverable. The experience at Michigan Medicine argues otherwise. Over a decade of integrated patient safety and communication-and-resolution work, patient safety event reports rose by 37.5%, while the proportion of events associated with harm fell from 10.5% to 6.7%. More detection tracked with less harm.
The obstetric evidence points in the same direction. Yale-New Haven's comprehensive safety program, including standardized care, teamwork, and strengthened clinical oversight, was associated with a decline in liability claims from 30 to 14 and in payments from $50.7 million to $2.9 million across matched five-year periods.
Neither study establishes causation, and both are single-institution. However, the direction is consistent, and the mechanism is not mysterious. Nuclear verdicts do not arise from a single failure. They arise when several control failures converge; fortunately, convergence can be identified and addressed much more easily than an individual event can be predicted.
The signal is clear well before the 12th return to the operating room. The only question is whether anyone is counting it.