In many ways, the trajectory of 2023 was similar to 2022 for the medical professional liability (MPL) industry. Direct written premium continued its slow trek upwards, the combined ratio remained virtually unchanged, prior-year reserve releases demonstrated a minor increase,
and policyholder dividends remained constant. However, investment performance improved and surplus recovered after a dip in 2022, leading to a slightly better year for the MPL industry in 2023 when compared to 2022.
Reported frequency remains below the reported frequencies observed in 2020 and prior, although the industry did see an increase relative to 2022. Despite continued favorable frequency indications, the combined ratio for the composite remained above 100%. Even though the composite experienced an underwriting loss for the eighth consecutive year, balance sheets remained well-capitalized, and the composite again provided policyholders with dividend
payments in 2023.
After a decrease in surplus for the composite in 2022 due to unrealized capital losses, surplus for the composite returned to its 2021 total, a healthy increase after the blip in 2022. Although the courts now appear to be running at or above pre-pandemic levels and total MPL payments continue to rise, unpaid claim liabilities have also increased for the fifth consecutive year.
Claim frequency, beginning in 2020, remains lower than historical averages, generally leading to favorable results for those coverage years thus far. What remains to be seen is whether the impact of the reduced frequency is permanent or temporary. The answer to this question will likely inform the results of coverage years 2024 and beyond.
As we noted last year, severity levels also moderated during the pandemic, following years of increased severity due to the disproportionate impact of large claims. It was our assumption that this pause in increasing severity was driven by pandemic-related court closures and other court-related slowdowns. In other words, the temporary flattening of severity was likely driven by the types of claims being settled. There was little evidence to suggest severity declines should be expected in the future, with inflation, social inflation, and the continued erosion of tort reforms each applying upward pressure on future severity. With the courts returning to normal, the types of claims closed in 2023 tended to be older than history would have suggested. This played out in 2023, as the increase in average severity was the highest in the last 20 years, while the frequency of large claims continues to grow.
We have based this picture of the current state of the MPL industry on the financial results of a composite of 52 of the largest specialty writers of MPL coverage. Using statutory data obtained from S&P Global Market Intelligence, we have compiled financial metrics for the industry based on:
- Written premium
- Reserve releases
- Overall operating results
- Capitalization
- Policyholder dividends
In considering the financial results, note that the 52 companies included in the metrics are all established MPL specialty writers. The composite excludes any MPL specialty writer that has become insolvent or otherwise left the market as well as multiline commercial writers and smaller writers. The companies in each of these three excluded categories are generally not capitalized as well as the 52 companies included here. In addition, the underwriting results of the multiline commercial writers, along with some of the smaller writers, have generally been less profitable. Of course, this is also true for the writers that became insolvent. Thus, the results presented below reflect the experience of the established specialty writers, which is inherently more favorable than a view of the whole industry.
WRITTEN PREMIUM
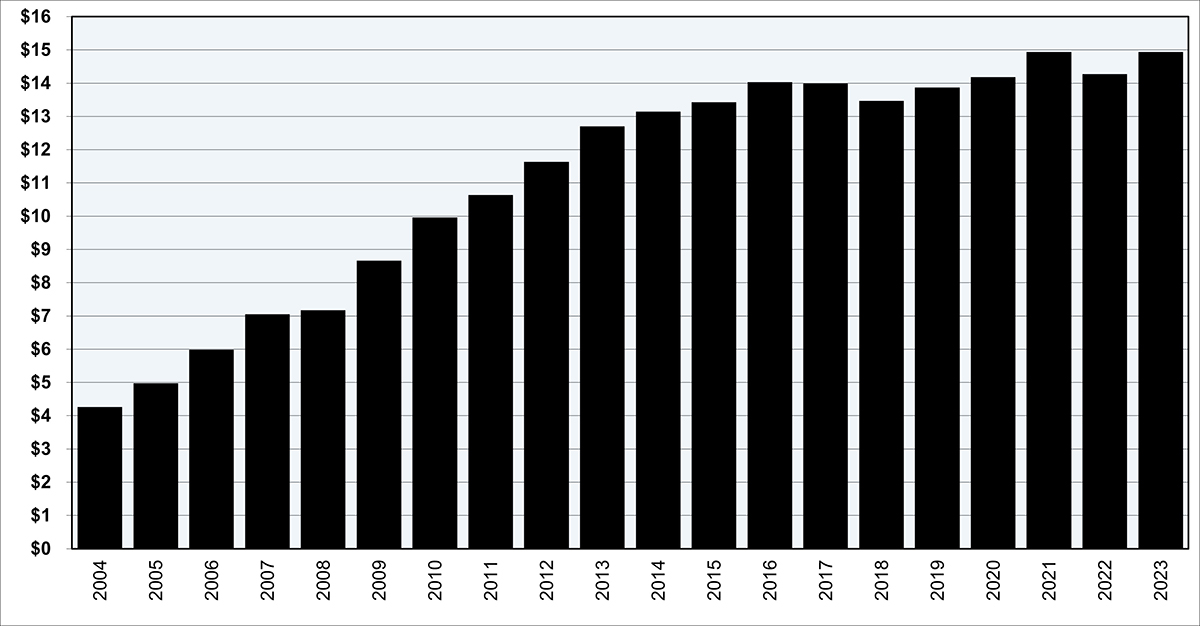
Direct written MPL premium for the composite grew by 1.5% during 2023 and reached nearly $4.6 billion, which is the highest overall MPL premium volume since 2007 as seen in Figure 1. The 1.5% growth in 2023 was similar to the growth experienced during 2022. While MPL premium growth appears to have stalled somewhat over the last two years after significant increases in both 2019 and 2021, the industry may still view this as a welcome sight after a decade straight of year-over-year premium decreases from 2007 through 2016. The annualized increase in direct written premium has been approximately 2.7% since it began its ascent in 2017.
Figure 1
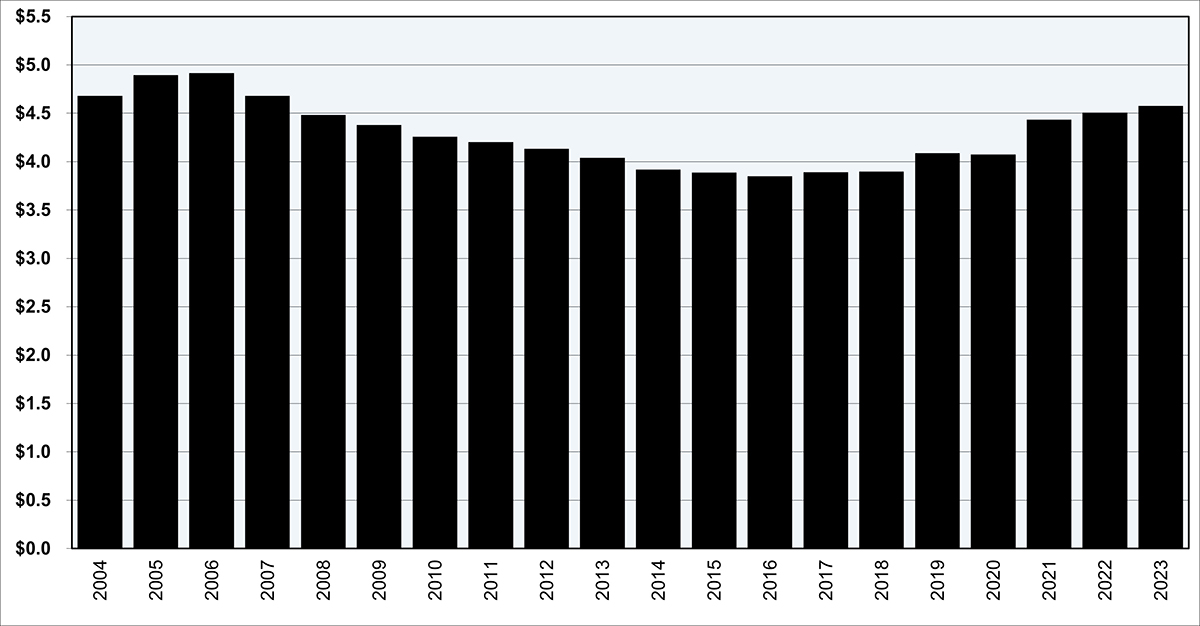
The distribution of direct written premium for the composite continues to shift away from physician premium and into hospitals, other professionals, and other facilities. In 2023, physician premium made up just under 77% of total MPL direct written premium, while premium for hospitals and other professionals made up 10% and 11%, respectively. The remaining 2% of direct written premium came from other facilities. Just ten years ago, however, physician premium was 84% of the total composite, while hospitals (6%), other professionals (9%), and other facilities (1%) accounted for a much smaller portion of the total direct written MPL premium.
Additional diversification, rate increases, and the contraction of schedule credits are likely needed for the composite to surpass the direct written MPL premium peak from 2006. However, as the industry put together a solid year and has a strong balance sheet, rate increases, as collected by Medical Liability Monitor, moderated somewhat in 2023 as competition remains strong.
RESERVE RELEASES
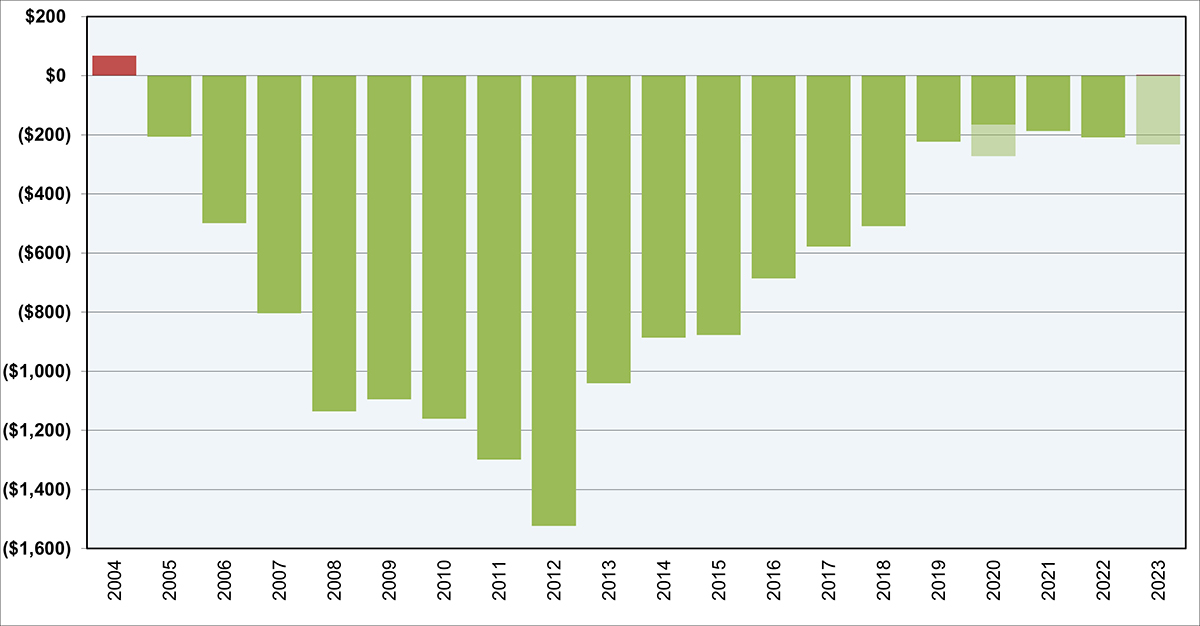
The composite released about $230 million in prior year reserves during 2023, after removing the impact of a large acquisition, for which the accounting treatment of the transaction distorted the prior year reserve release as stated in Schedule P—Part 2. There was an acquisition in 2020 that was accounted for similarly, and the impact of these transactions are shown by the light green portion of the bars in Figure 2. 2023 marks the fifth consecutive year of reserve
releases well-below $500 million. From 2007 through 2018, the composite’s lowest reserve release had been $500 million, with an average reserve release of nearly $1 billion.
Figure 2
The contracting prior year reserve releases in recent years continues to add to a rising level of carried reserves for the composite. The composite’s unpaid loss and loss adjustment expenses (LAE) reserves have increased from approximately $10.6 billion in 2020 to nearly $12 billion in 2023, which is an increase of more than 12%. This despite roughly the same number of open claims at year-end 2023 when compared to year-end 2020 based on a review of Schedule
P, Part 5 data. This period included a 6% increase in open claim inventories for this composite in 2021 followed by decreases of 4% between 2021 and 2022 and 3% between 2022 and 2023. This appears to be an indication that companies have started to work through their open claim
inventory that has been aging due to COVID-related court slowdowns and closures.

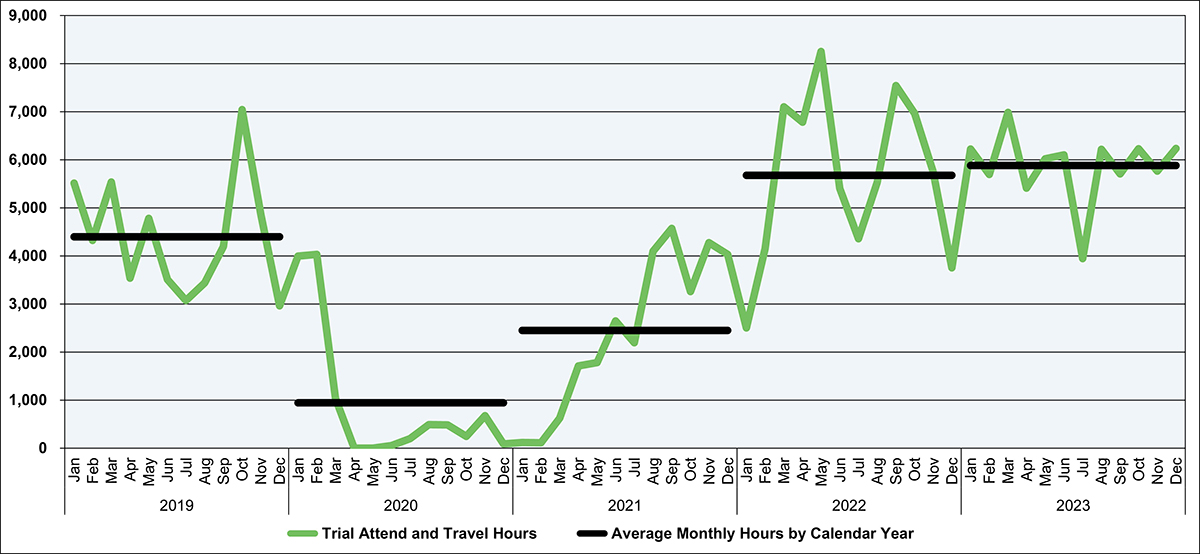
As in past years, we can see the impact of the pandemic on the courts by observing the number of trial attendance and travel hours invoiced by attorneys in Figure 3. Using a proprietary database containing on average 36,000 open claims at any given time over the last five years, we observed trial hours near-zero for almost 12 months across 2020 and the beginning of 2021. Those hours gradually began to rise beginning in March of 2021, and during 2022 and 2023
they appear to have recovered and even surpassed pre-pandemic levels, as insurers and claims professionals attempted to work through the backlog of claims that had built up
during 2020 and 2021. The reduction in trial hours during 2020 and 2021 appears to have had a direct impact on the ability of insurers to move claims through the process, which led to fewer payments during 2020 and 2021 throughout the industry, as described in prior articles.
Figure 3
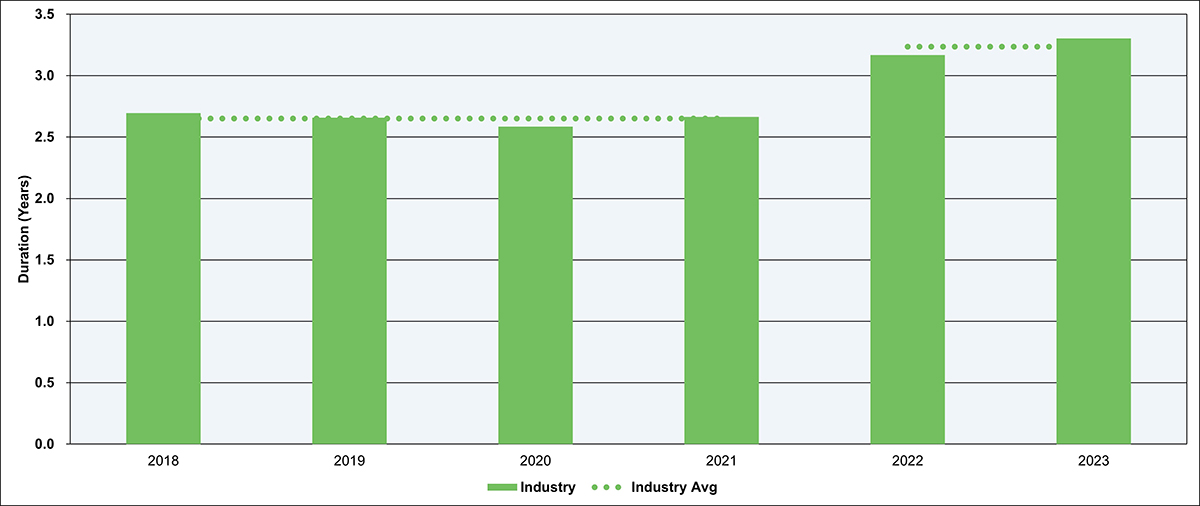
Trial hours and Quarterly Statement payment data appear to be positively correlated. Between 2019 and 2021, payments fell by about 20%, due in part to the COVID-related court slowdowns and closures; however, payments made during the last five quarters (fourth quarter of 2022 and all of 2023) are greater than any other individual quarter from 2016 through the third quarter of 2022, another sign that insurers are working through the backlog of their open claim inventory as seen in Figure 4. These delays have caused the average duration, which is defined as the time from report date to close date, for claims closed during 2022 and 2023 to increase by over 20% when compared to those claims that closed between 2018 and 2021 as seen in Figure 5. This data, from the same proprietary database, contains an average of nearly 12,000 closed claims per year. The COVID-related slowdowns not only caused reserves to be held longer,
but also may have resulted in higher claim severities for both loss and defense costs, leading to the increase in carried reserves, despite the elevated loss payments during the last five quarters.
Figure 4
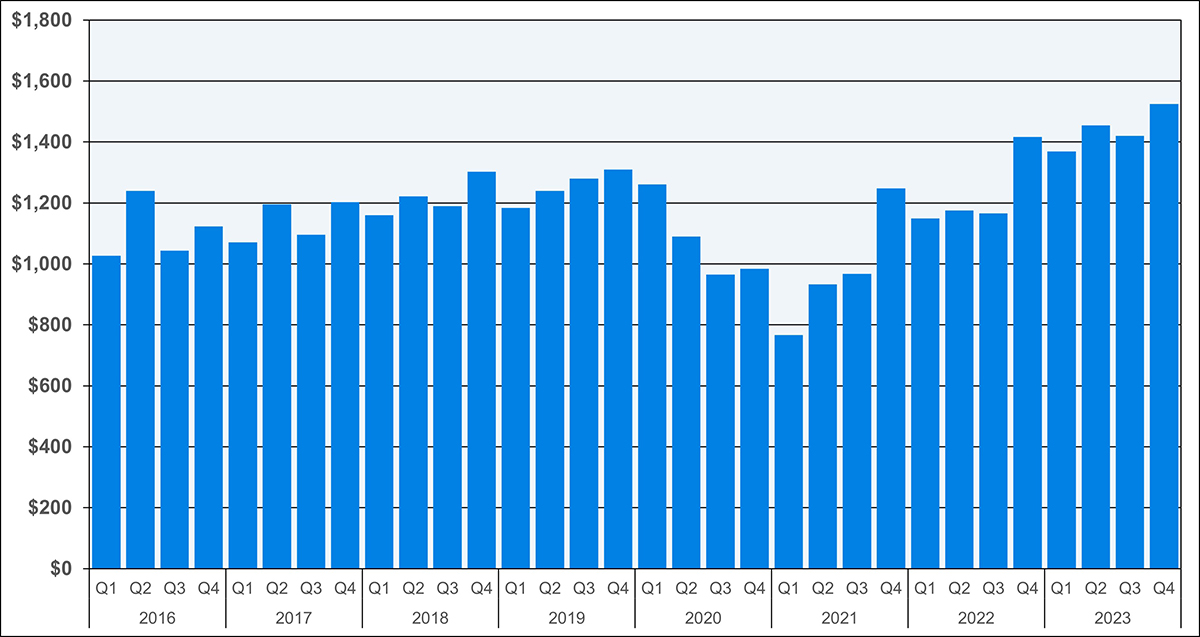
Figure 5
OVERALL OPERATING RESULTS
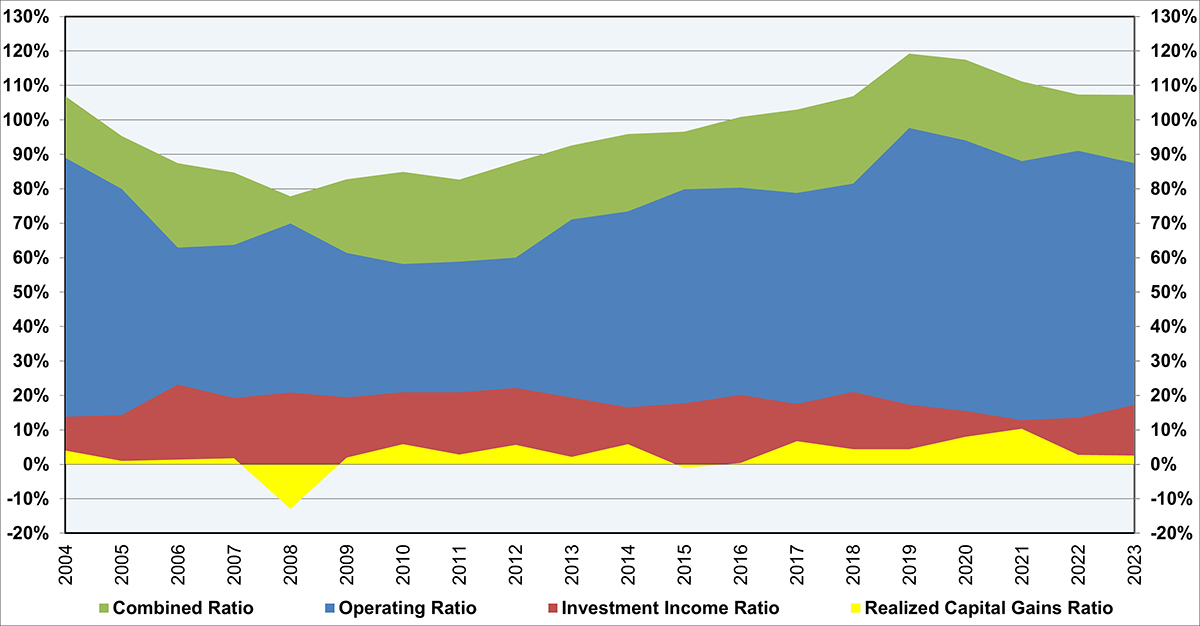
The 2023 operating ratio improved by approximately 3.5-points compared to 2022, despite essentially no change to the combined ratio as seen in Figure 6. Interestingly, the calendar year loss ratio improved by nearly 6-points to 43%. This was offset by an approximately 4.5-point deterioration in the calendar year LAE ratio to 34% and a 1-point deterioration in the underwriting expense ratio to 27%. Therefore, the improvement in the operating ratio can be almost entirely attributed to a nearly 4-point increase in the investment income ratio, while the realized capital gains ratio was essentially flat compared to 2022. Buoyed by the superior performance of the financial markets in 2023 compared to 2022 and the improved investment income ratio, the 2023 operating ratio for the composite was the lowest since 2018.
As mentioned previously, after adjusting for a large acquisition, reserve releases have remained relatively flat since 2019. The approximately 5% benefit to the operating ratio in recent years remains significantly lower than the double-digit percent releases of 2006 through 2018 that
were oftentimes more than 20%. Underwriting expenses increased slightly relative to premium as “people costs” increased in 2023. Combined ratios remain above 100%, and have since 2016, as seen in Figure 6. As such, the composite continues to rely on investment income for profitability.
Figure 6
The composite’s initial coverage year loss and LAE ratio remained at 83% in 2023 after excluding the impact of the large acquisition mentioned previously. This is a 10-point
decrease from the initial coverage year loss and LAE ratio of 93% in 2019. As was the case in 2022, there are possible frequency-related reasons for the lower initial loss and LAE ratio. The lower initial loss and LAE ratios may continue the slowdown in prior-year reserve releases going forward, if severities continue to rise, causing the loss and LAE to follow the premium levels.
CAPITALIZATION
After a nearly 4.5-point decrease to the composite’s policyholders’ surplus during 2022 due to unrealized capital losses, the composite quickly bounced back, recording a $650 million increase or 4.6% to policyholders’ surplus during 2023 as seen in Figure 7. This returns the composite to its peak policyholders’ surplus of $14.9 billion in 2021. A $140 million increase to net income, coupled with a return to normalcy related to unrealized capital gains were the
primary drivers of the surplus increase.
Figure 7
The composite’s capitalization, as measured by its risk-based capital (RBC) ratio remains strong relative to most other insurance segments, per results aggregated from S&P Global Market Intelligence. The RBC ratio provides a comparison of a company’s statutory surplus to the minimum amount needed from a regulatory perspective (although, from a practical perspective, the minimum amount of capital needed is well over this regulatory minimum). The RBC ratio for the composite remains around 900%.
POLICYHOLDER DIVIDENDS
Policyholder dividends for the composite increased slightly in 2023 to $125 million, however, this is roughly 50% lower than the average policyholder dividend paid by the composite between 2007 and 2019, which was $250 million. Historically, these policyholder dividend payments were likely funded, in part, by the composite’s reserve releases, which, as mentioned previously, have dwindled in recent years.
However, as a percentage of net income, dividends have remained relatively stable. From 2007 onwards, dividend payments to policyholders have consistently averaged 20%-25% of pre-dividend net income. 2023 was no different for the composite’s policyholders, as dividends paid
were approximately 20% of the pre-dividend net income. Although the total composite has remained relatively steady with policyholder dividends, the number of companies providing dividends has declined by 30% in the last five years as competition remains heavy. Therefore, fewer than one-third of the composite’s companies paid policyholder dividends in 2023.
WHAT’S NEXT?
One view within the industry is that frequency will eventually return to pre-pandemic levels, and perhaps continue higher. While frequency has increased slightly in 2022 and 2023 from the all-time low points observed in 2020 and 2021, much of the industry is still at or below the levels experienced prior to the pandemic. Questions remain about whether increased patient safety initiatives can keep frequency at these levels for the long-term, or whether tides will turn, and the industry will experience its first period of widespread frequency increases in decades.
There continue to be headwinds that may indicate a frequency increase sooner than later, combined with the continuation of rising severities. Tort reform, including caps on damages, plaintiff attorney fee schedules, and more, continue to shift towards the plaintiff’s bar in recent years. Since 2022, several states have overturned or renegotiated existing damage caps, including New Mexico, California, Iowa, and Nevada, while other states enacted additional legislature by overturning “venue shopping” laws or changing collateral source rules. It continues to remain as important as ever for insurers to monitor this activity and respond to
these changes to remain both competitive and profitable.
Overall, the MPL industry remains well capitalized; however, the long-standing goal of sustained underwriting profitability remains at an arm’s length, at least for now. The decisions that industry leaders make going forward will be ones to keep a close eye on.
References
1 Database compiled and maintained by https://www.milliman-datalytics.com/